


July Took a Breather
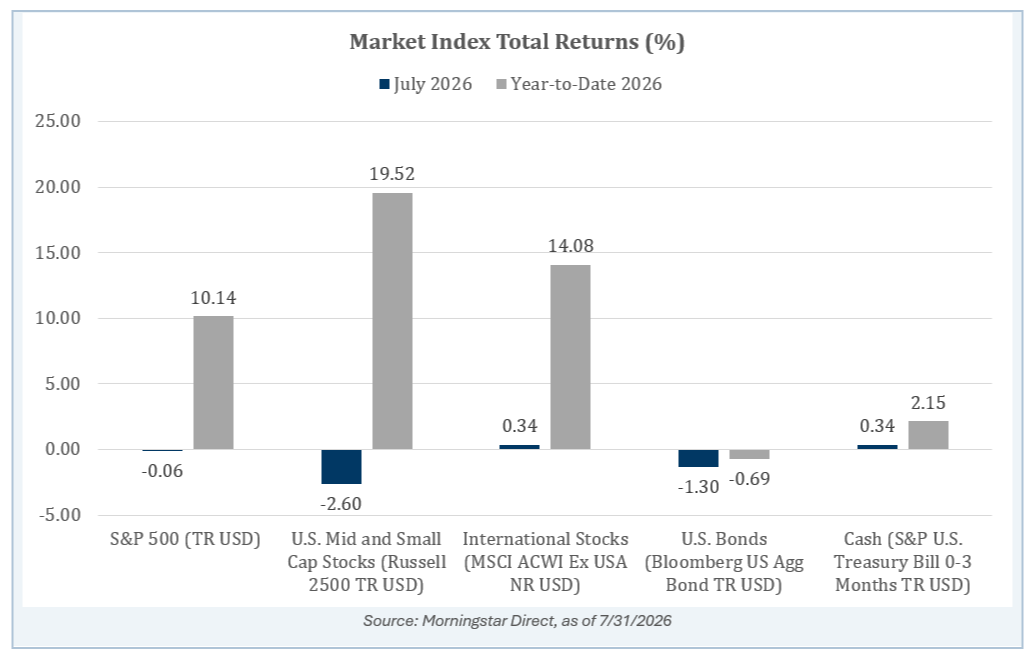
Markets were mostly lower in July, bucking the historical tendency for July to be a stronger summer month. The S&P 500 was essentially flat, declining 0.06%, while U.S. mid and small-cap stocks declined 2.60%. International stocks and cash were both up 0.34%, and U.S. bonds declined 1.30%.¹
That kind of summer pause can be healthy. Markets had entered July with strong year-to-date gains, and a quieter month can allow expectations to reset as investors move through earnings season and reassess the outlook for the balance of 2026.
Year-to-date results remain positive for equities. Through July, the S&P 500 was up 10.14%, U.S. mid and small-cap stocks were up 19.52%, and international stocks were up 14.08%. Bonds were slightly negative, while cash continued to provide a modest positive return.¹
The Fed Remains the Main Source of Uncertainty
The Federal Reserve held rates steady in July, but the path from here appears less settled. A key issue for markets has been the limited forward guidance from the new Federal Reserve chair. Without clear guidance on whether the Fed intends to hold rates steady or tighten policy further, both stock and bond markets may continue to react sharply to incoming inflation, employment, and growth data.
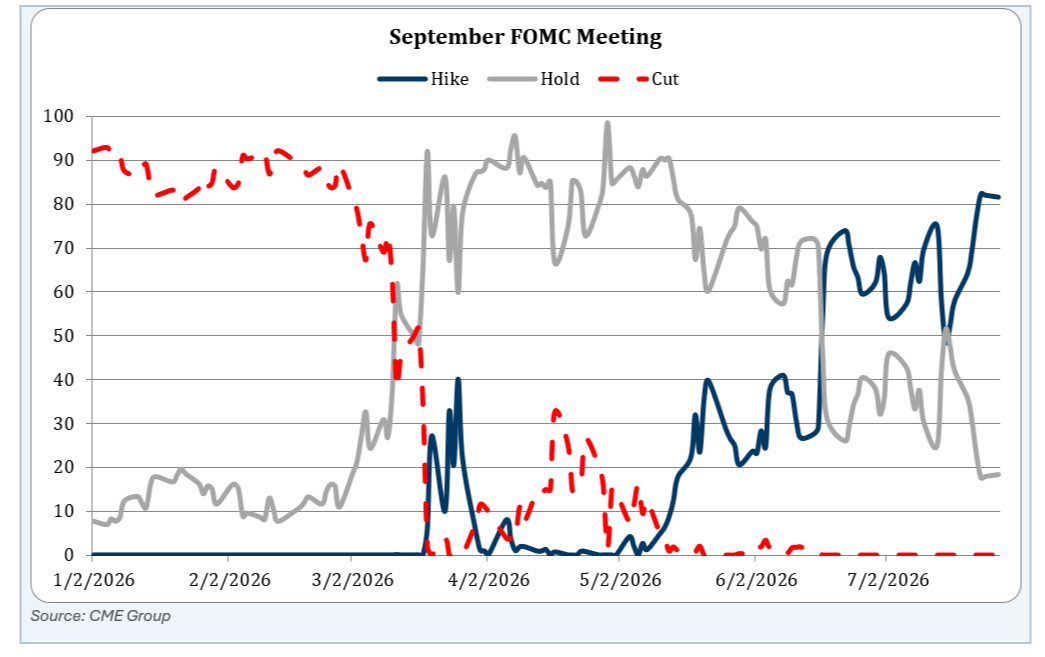
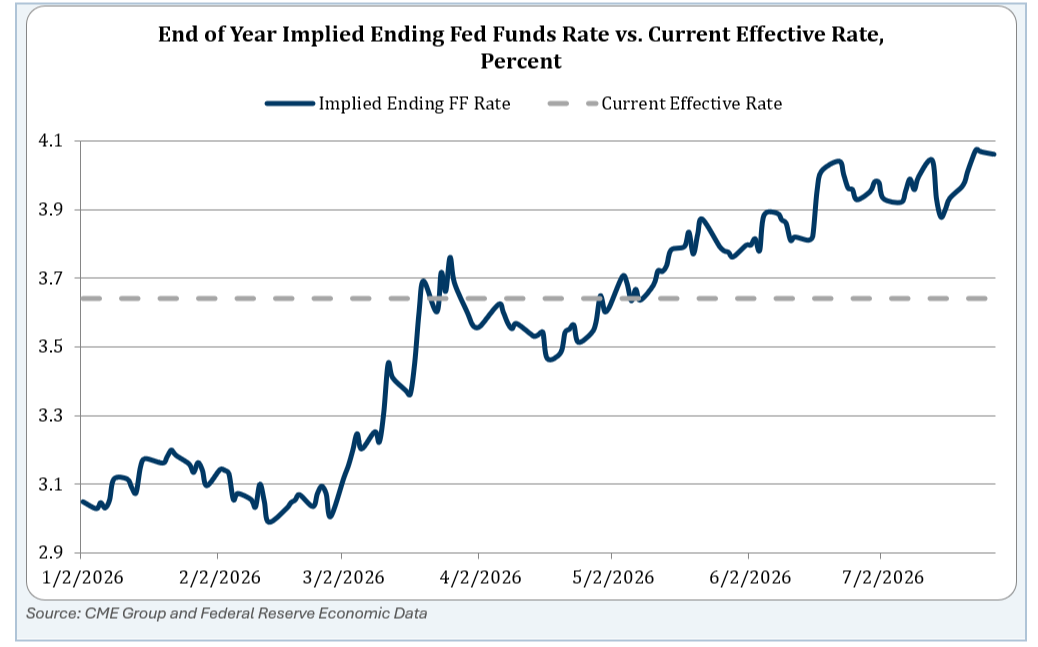
According to CME Group data, September appears to be a “live” meeting. The probability of a rate hike moved from essentially zero earlier in the year to roughly 80% by late July, while expectations for a rate cut have largely disappeared.²
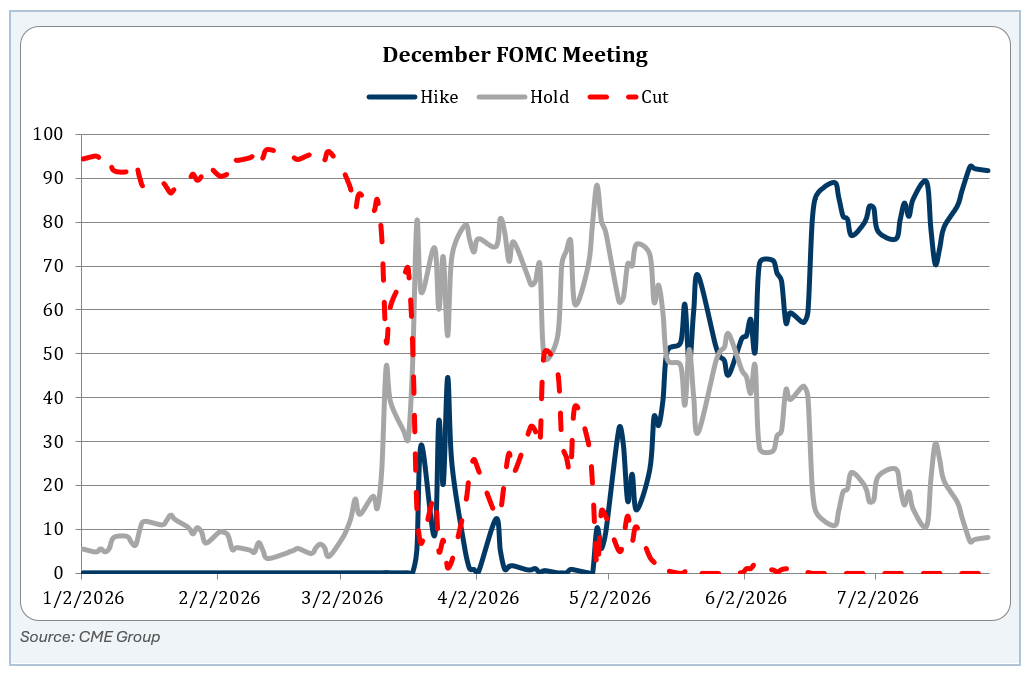
By year-end, the market-implied odds of at least one rate hike were even higher, near 90%.² Importantly, the Fed has limited ability to address several current inflation pressures directly, including oil volatility, tariff-related inflation, and possible AI infrastructure inflation tied to data-center buildouts.
Higher Yields Are Already Tightening Conditions
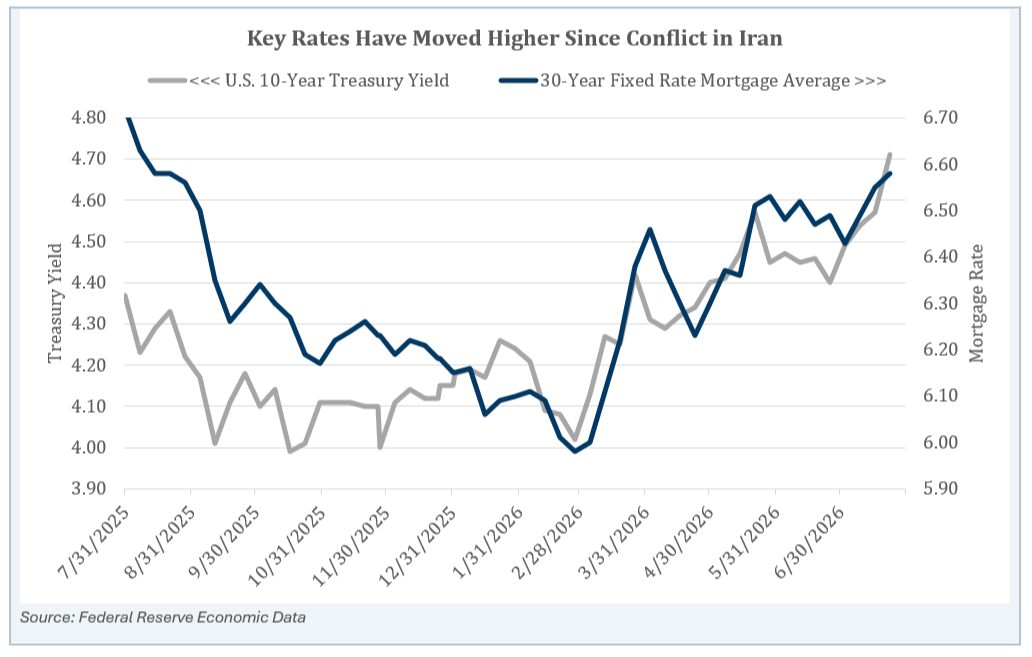
Even before the Fed moves, markets can tighten financial conditions on their own. Short-term interest rates could move above today’s levels if the Fed hikes, but longer-term yields have already moved higher in anticipation. The 10-year Treasury yield was around 4.7%, compared with roughly the mid-4% range earlier in the year.³
That matters because longer-term yields influence borrowing costs for businesses and consumers. Mortgage rates also remain elevated, with the 30-year fixed mortgage rate shown near 6.6%.³ For households considering a home purchase, affordability remains challenged. For companies, higher borrowing costs can slow investment and create a less accommodative backdrop for growth.
If the Fed Hikes, Pace Matters
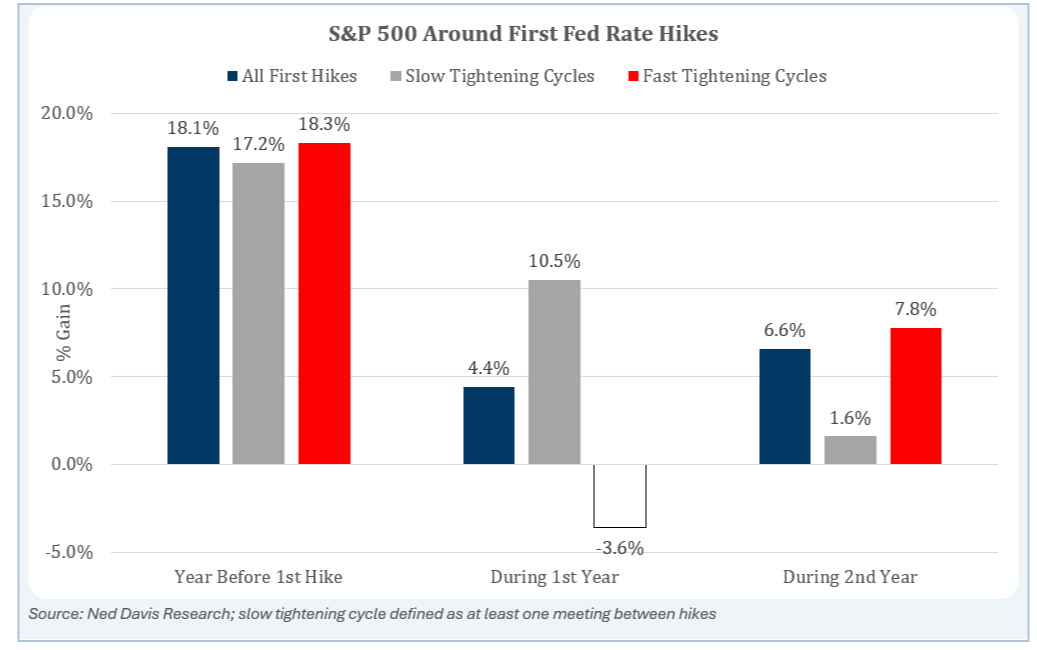
The natural question is what a rate hike would mean for stocks. History suggests the answer depends on the pace of tightening. Slow tightening cycles, defined as cycles with at least one meeting between hikes, have historically been easier for markets to digest than fast tightening cycles.⁴
In the first year after an initial rate hike, slow tightening cycles have historically produced an average return of about 10.5%, compared with negative 3.6% for fast tightening cycles.⁴ That does not guarantee a specific outcome, but it does suggest that a measured pace from the Fed can be less disruptive than a rapid series of rate increases.
Bearish Sentiment May Be a Contrarian Support
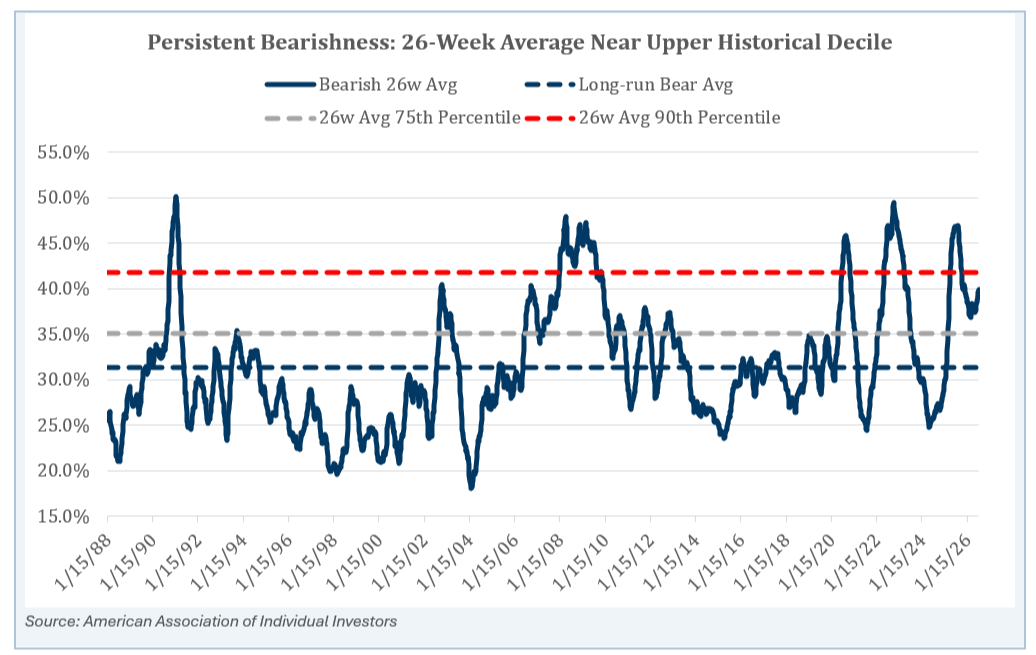
Investor sentiment remains cautious. The AAII bearish sentiment 26-week average was approximately 40.0%, compared with a long-run average of 31.4%, placing bearishness near the 88th percentile. Bears have also outnumbered bulls in 30 of the past 52 weeks, and bearish sentiment has been above its long-run average in 45 of the past 52 weeks.⁵
This is notable because sentiment can operate as a contrarian indicator. Markets often climb a wall of worry, and elevated bearishness suggests conditions are not characterized by broad euphoria. With corporate earnings still generally constructive, cautious positioning may leave room for markets to respond positively if incoming data proves less challenging than feared.
Bottom Line
July was not a strong month, but it was also not a major setback. Equity returns remain solidly positive year-to-date, while the Fed, interest rates, inflation, and investor sentiment remain the key areas to watch. A disciplined allocation across stocks, bonds, and cash remains important, especially when policy expectations and market sentiment are moving quickly.
Sources
1. Morningstar Direct market return data, as of 7/31/2026.
2. CME Group data, including September and year-end 2026 Fed probability charts.
3. Federal Reserve Economic Data and CME Group data, including 10-year Treasury yield, 30-year fixed mortgage rate, implied ending Fed Funds rate, and current effective rate.
4. Ned Davis Research data on S&P 500 performance around slow and fast tightening cycles.
5. American Association of Individual Investors sentiment, including 26-week bearish sentiment average, long-run average, and percentile context.
Disclosures & Definitions
Index Benchmarks presented within this report may not reflect factors relevant for your portfolio or your unique risks, goals or investment objectives. Past performance of an index is not an indication or guarantee of future results. It is not possible to invest directly in an index.
The Standard & Poor's 500 (S&P 500) is a market-cap weighted index comprised of the common stocks of 500 leading companies in leading industries of the U.S. economy. You cannot invest directly in an index.
The Bloomberg Aggregate Bond® Index broadly tracks the performance of the U.S. investment-grade bond market. The index is composed of investment-grade government and corporate bonds.
The MSCI ACWI ex USA Growth Index captures large and mid cap securities exhibiting overall growth style characteristics across 22 Developed Markets (DM) countries and 24 Emerging Markets (EM) countries
The Russell 2500™ Index measures the performance of the small to midcap segment of the US equity universe, commonly referred to as "smid" cap. The Russell 2500 Index is a subset of the Russell 3000® Index. It includes approximately 2500 of the smallest securities based on a combination of their market cap and current index membership.
The S&P U.S. Treasury Bill 0-3 Month Index is designed to measure the performance of U.S. Treasury bills maturing in 0 to 3 months.
A Certified Investment Management Analyst (CIMA) is a professional credential for financial advisors and investment consultants. It focuses strictly on advanced portfolio management, asset allocation, and risk assessment.
The Chicago Mercantile Exchange (CME) Group Inc. is a financial services company. Headquartered in Chicago, the company operates financial derivatives exchanges including the Chicago Mercantile Exchange, Chicago Board of Trade, New York Mercantile Exchange, and The Commodity Exchange. The company also owns 27% of S&P Dow Jones Indices.
The Federal Open Market Committee (FOMC) is the branch of the Federal Reserve System that determines the direction of monetary policy. The FOMC has 12 voting members, including all seven members of the Board of Governors and a rotating group of five Reserve Bank presidents. The Chair of the Board of Governors also serves as Chair of the FOMC.
Advisory Persons of Thrivent Advisor Network provide advisory services under a “doing business as” name or may have their own legal business entities. However, advisory services are engaged exclusively through Thrivent Advisor Network, LLC, a registered investment adviser. RetirePath Advisors and Thrivent Advisor Network, LLC are not affiliated companies. Information in this message is for the intended recipient[s] only. Please visit our website: retirepathadvisors.com for important disclosures.
Securities offered through Thrivent Investment Management Inc. (“TIMI”), member FINRA and SIPC, and a subsidiary of Thrivent, the marketing name for Thrivent Financial for Lutherans. Thrivent.com/disclosures. TIMI and RetirePath Advisors are not affiliated companies.
This material is provided for informational purposes only and is not intended to be relied upon as a forecast, research or investment advice, and is not a recommendation, offer or solicitation to buy or sell any securities or to adopt any investment strategy. The views and strategies described may not be suitable for all investors. They also do not include all fees or expenses that may be incurred by investing in specific products. Past performance is no guarantee of future results.