Markets Broaden, Even as June Was Mixed
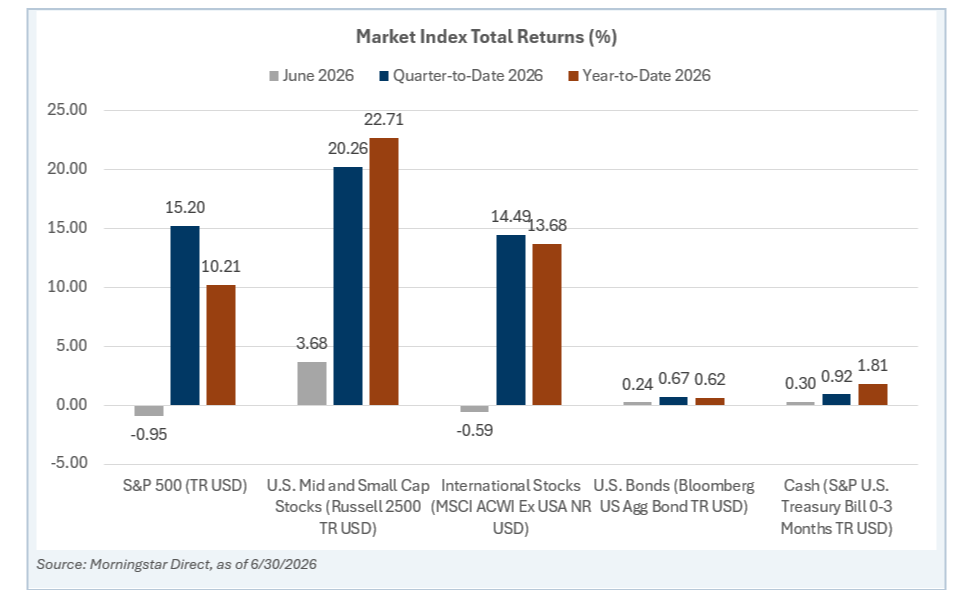
June was a mixed month for major markets, but the bigger story is that the second quarter was one of the strongest quarters for stocks in several years. The S&P 500 declined 0.95% in June, international stocks slipped 0.59%, while bonds and cash were modestly positive. The clear bright spot was U.S. small and mid-cap stocks, which gained 3.68% for the month.
For the quarter, results were much stronger: the S&P 500 rose 15.20%, small and mid-cap stocks gained 20.26%, and international stocks advanced 14.49%. Year-to-date, all three major equity categories remained solidly positive, with small and mid-cap stocks leading the way.
Leadership Is Shifting Beneath the Surface
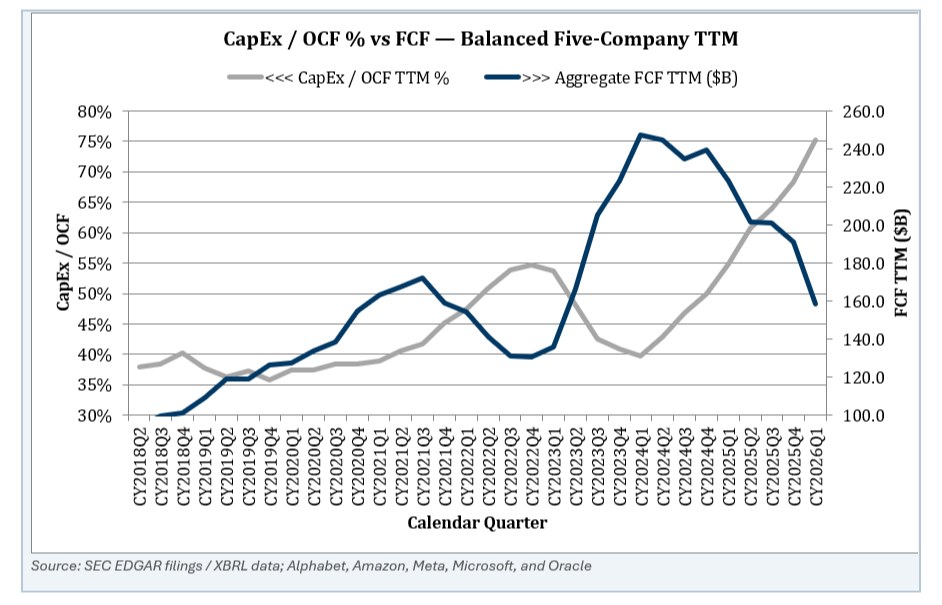
One of the more important themes beneath the surface is that market leadership has broadened beyond the largest technology companies. Mega-cap technology names, including Microsoft, Alphabet, Meta, Amazon, and others, have spent aggressively to support artificial intelligence infrastructure. Capital expenditures for large AI-related companies had climbed to roughly 75% of cash flow.
That level of spending may support long-term innovation, but it can also pressure free cash flow, increase leverage, and reduce some of the quality metrics markets have historically rewarded. In other words, investors appear to be looking not only at growth potential, but also at balance-sheet discipline and cash-flow durability.
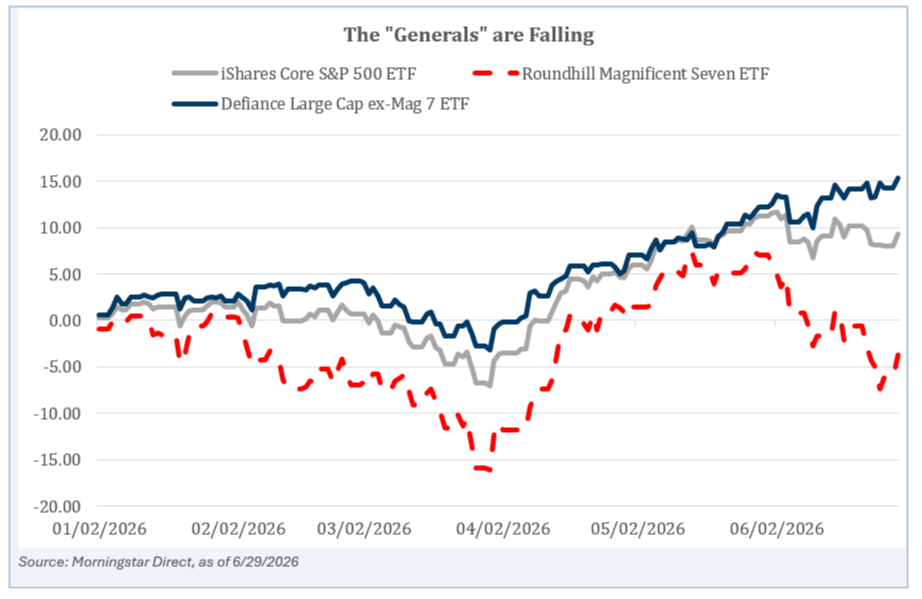
That shift has shown up in performance. While the S&P 500 was up roughly 10% year-to-date near the end of June, the Magnificent 7 group was down about 5%, while the S&P 500 excluding those seven names was up more than 15%. This is not necessarily a negative development. Bull markets are often healthier when participation expands beyond a narrow group of stocks.
Oil Prices Have Eased, but Geopolitics Remain Fluid
Energy markets were another major focus. The U.S.-Iran Memorandum of Understanding initially helped ease fears around the Strait of Hormuz, one of the world’s most important energy shipping lanes. Ship traffic is beginning to improve from very depressed levels, though still far below prior-year averages. More recent reports indicate the agreement remains fragile and the situation continues to evolve, so this remains an area to monitor rather than a fully resolved risk.
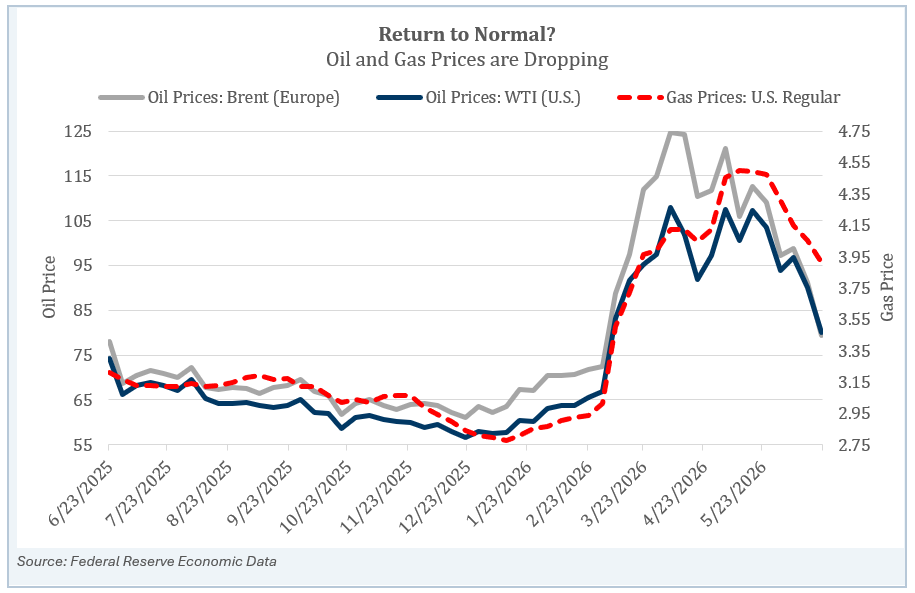
Oil prices have nevertheless moved meaningfully lower from their spring highs. Brent and WTI crude both climbed into the $100+ range earlier this year, but by late June had moved back toward the high-$70s to low-$80s range. Gasoline prices have also eased, with U.S. regular gas moving below $4 per gallon in the deck’s data. For consumers, especially during summer travel season, lower energy prices can provide some welcome relief.
Inflation Expectations and the Fed
Lower oil prices have also helped ease market-based inflation expectations. Five-year expected inflation fell to roughly 2.2% by late June, down from the higher levels reached during the peak of the energy-price shock. That matters because persistent inflation can pressure both stock and bond returns. For stocks, higher inflation can lead to higher discount rates and more volatility. For bonds, inflation can reduce the real value of fixed interest payments.
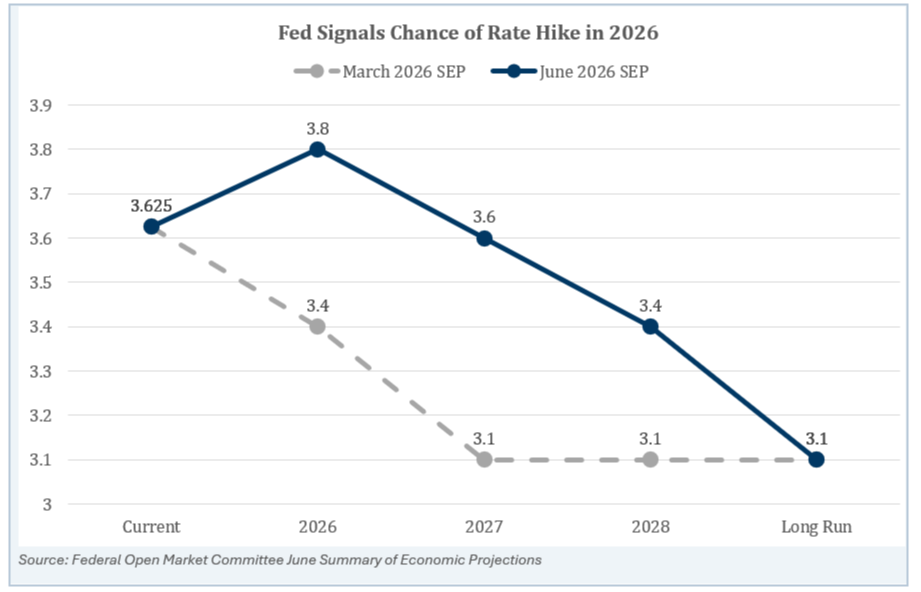
The Federal Reserve remains the key policy variable. Under new Fed Chair Kevin Warsh, the June Summary of Economic Projections showed a more cautious stance than March. In March, no Fed participants projected rates higher by year-end, while 12 expected lower rates. By June, 9 participants projected higher rates, 8 expected unchanged rates, and only 1 expected lower rates. The median projected year-end 2026 federal funds rate moved from 3.4% in March to 3.8% in June.
Bottom Line
Markets have had a strong start to the year, but leadership, energy prices, inflation expectations, and Fed policy are all moving pieces. This environment reinforces the importance of staying diversified across stocks, bonds, and cash, while maintaining a disciplined long-term plan.
Disclosures & Definitions
Index Benchmarks presented within this report may not reflect factors relevant for your portfolio or your unique risks, goals or investment objectives. Past performance of an index is not an indication or guarantee of future results. It is not possible to invest directly in an index.
The Standard & Poor's 500 (S&P 500) is a market-cap weighted index comprised of the common stocks of 500 leading companies in leading industries of the U.S. economy. You cannot invest directly in an index.
The Bloomberg Aggregate Bond® Index broadly tracks the performance of the U.S. investment-grade bond market. The index is composed of investment-grade government and corporate bonds.
The MSCI ACWI ex USA Growth Index captures large and mid cap securities exhibiting overall growth style characteristics across 22 Developed Markets (DM) countries and 24 Emerging Markets (EM) countries*. The growth investment style characteristics for index construction are defined using five variables: long-term forward EPS growth rate, short-term forward EPS growth rate,current internal growth rate and long-term historical EPS growth trend and long-term historical sales per share growth trend.
The Russell 2500™ Index measures the performance of the small to midcap segment of the US equity universe, commonly referred to as "smid" cap. The Russell 2500 Index is a subset of the Russell 3000® Index. It includes approximately 2500 of the smallest securities based on a combination of their market cap and current index membership.
The S&P U.S. Treasury Bill 0-3 Month Index is designed to measure the performance of U.S. Treasury bills maturing in 0 to 3 months.
The West Texas Intermediate Index (WTI),is the main oil benchmark for North America as it is sourced from the United States, primarily from the Permian Basin. The oil comes mainly from Texas.
Brent crude oil is a blended oil (a mix of brent, forties, oseberg and ekofisk) drilled from below the North Sea. It is popularly refined into diesel fuel and gasoline. In trading, Brent is one of the benchmarks for oil in the wider market, such as the Middle East, Europe and Africa. It is one of three major oil benchmarks used by those trading oil contracts, futures and derivatives. The other two major benchmarks are West Texas Intermediate (WTI) and Dubai/Oman, though there are many smaller oil varieties traded as well.
Capital expenditure or capital expense (abbreviated capex, CAPEX, or CapEx) is the money an organization or corporate entity spends to buy, maintain, or improve its fixed assets, such as buildings, vehicles, equipment, or land.
An exchange-traded fund (ETF) is a type of pooled investment security that operates much like a mutual fund. Typically, ETFs will track a particular index, sector, commodity, or other assets, but unlike mutual funds, ETFs can be purchased or sold on a stock exchange the same way that a regular stock can.
FCF stands for Free Cash Flow. In finance, it represents the exact amount of cash a business generates after covering its operating expenses and capital expenditures (CapEx).
The Magnificent 7 (or Mag-7) stocks are a group of mega-cap stocks that drive the market’s performance due to their heavy weighting in major stock indexes such as the Standard & Poor’s 500 and the Nasdaq 100. The group’s seven stocks earned their name in 2023 due to their strong performance and ability to power indexes higher seemingly without help from smaller stocks. The Magnificent 7 includes the following: Apple (AAPL), Microsoft (MSFT), Alphabet (GOOG and GOOGL), Amazon (AMZN), NVIDIA (NVDA), Tesla (TSLA), and Meta Platforms (META).
This material is provided for informational purposes only and is not intended to be relied upon as a forecast, research or investment advice, and is not a recommendation, offer or solicitation to buy or sell any securities or to adopt any investment strategy. The views and strategies described may not be suitable for all investors. They also do not include all fees or expenses that may be incurred by investing in specific products. Past performance is no guarantee of future results.
Advisory Persons of Thrivent Advisor Network provide advisory services under a “doing business as” name or may have their own legal business entities. However, advisory services are engaged exclusively through Thrivent Advisor Network, LLC, a registered investment adviser. RetirePath Advisors and Thrivent Advisor Network, LLC are not affiliated companies. Information in this message is for the intended recipient[s] only. Please visit our website: retirepathadvisors.com for important disclosures.
Securities offered through Thrivent Investment Management Inc. (“TIMI”), member FINRA and SIPC, and a subsidiary of Thrivent, the marketing name for Thrivent Financial for Lutherans. Thrivent.com/disclosures. TIMI and RetirePath Advisors are not affiliated companies.


