

Greetings, valued investors!
As we turn the page on a vibrant August 2025, I'm thrilled to share my latest insights in this Monthly Market Memo. As your Chief Investment Officer at RetirePath Advisors, I'm here to unpack the key market movers, spotlight the Federal Reserve's recent signals, and address the questions on your mind. From a robust rally in U.S. small caps to the anticipation of rate cuts, let’s explore what drove markets last month and what it means for you.
Another Strong Month for Stocks and Bonds
August built on the positive momentum from May, June, and July, marking several consecutive months of gains in the stock market. The rally was particularly led by U.S. small-cap companies, but broad gains were seen across the board.
Here's a snapshot of major asset class performance for the month:
- S&P 500: +2.03%
- International Stocks (MSCI ACWI ex US TR USD): +3.47%
- U.S. Small-Cap Stocks: +7.14%
- U.S. Intermediate Bonds (Bloomberg Aggregate Bond Index): +1.20%
- Cash: Modestly positive at 0.38%
Notably, every major asset class we track outperformed cash, underscoring the benefits of staying invested. Areas beyond the largest U.S. companies—such as international equities and small caps—added significant value.
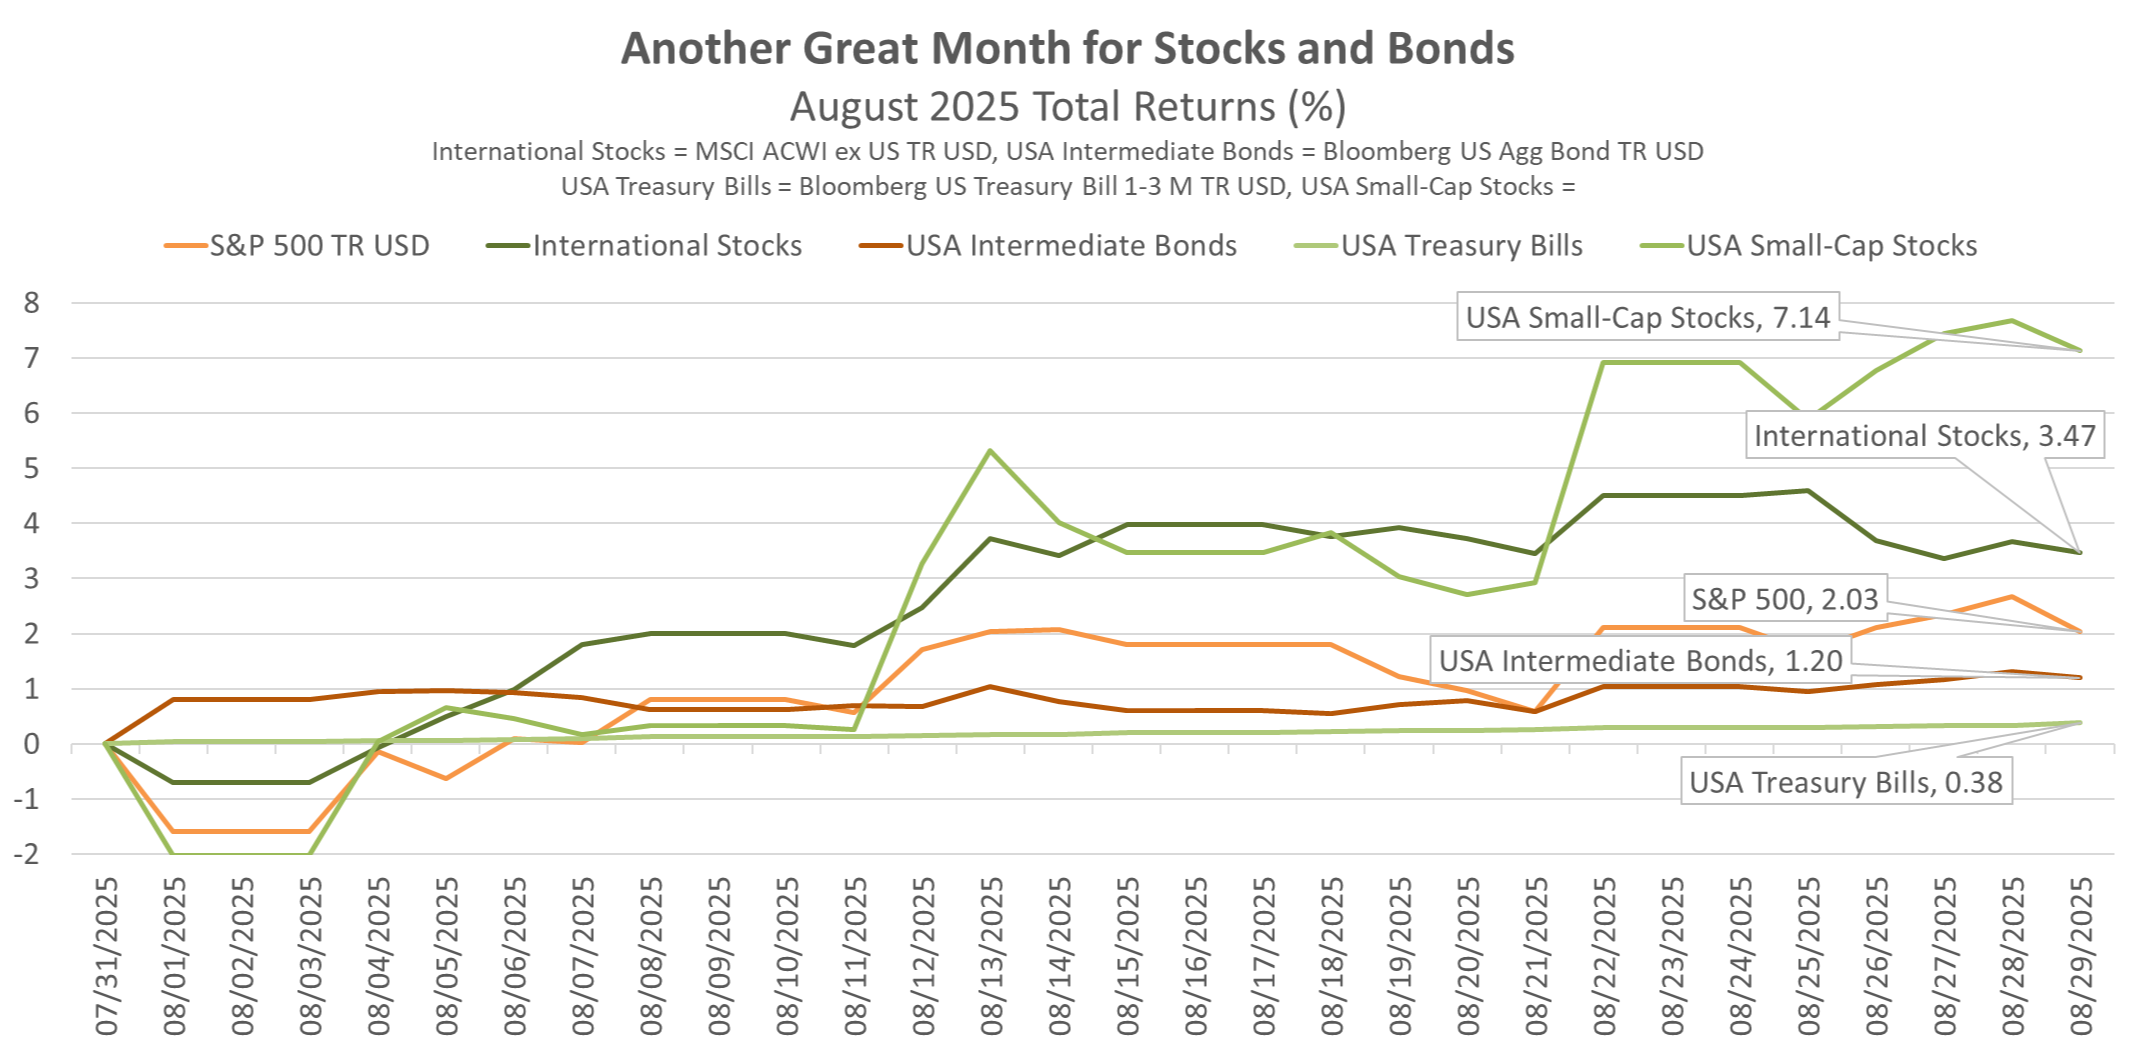
A standout event was the market surge a couple of weeks ago on Friday, following Federal Reserve Chair Jerome Powell's speech at the Jackson Hole Economic Symposium. Small caps, internationals, the S&P 500, and even bonds rallied sharply in response.
Insights from the Jackson Hole Symposium
The Jackson Hole meeting, hosted annually by the Kansas City Federal Reserve in Wyoming, often bridges the gap between major Fed meetings. This year's event came between July's Fed gathering and the upcoming September meeting, filling a lull in policy updates.
Chair Powell's remarks emphasized a shift in focus toward the labor market, highlighting risks there and signaling that current interest rates are sufficiently restrictive. Markets interpreted this as a green light for potential rate cuts, with a 90% probability (see below chart) of a 25-basis point (1/4 of 1%) now expected in for September.
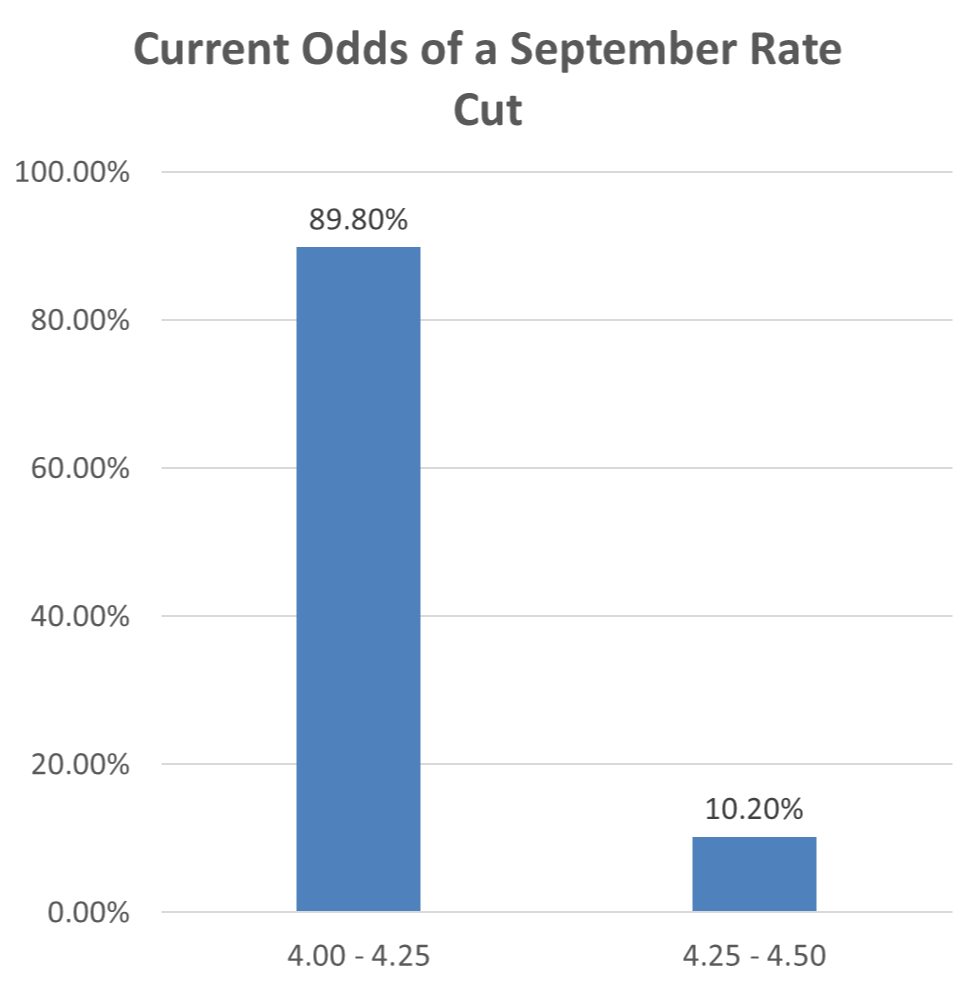
To set the context, the federal funds rate remains elevated at around 4.33% (see below chart)—historically high compared to post-financial crisis norms. This rate influences everything from CD yields at your bank to overnight lending costs.
 Source: Federal Reserve Economic Data (FRED)
Key upcoming data, including Friday's (9/5/2025) jobs report and next week's inflation figures, could sway these odds slightly. However, the market's anticipation of cuts has already boosted equities.
The Fed's Dual Mandate: Spotlight on Employment
The Fed's dual mandate balances maximum employment and stable prices (inflation control). With inflation cooling—though not fully tamed—the emphasis has shifted to employment risks, especially under the current administration.
Looking at the Fed's own projections from June, they anticipated the unemployment rate ending the year between 4.0% and 4.7% (see chart below), with expectations ticking slightly higher since their prior meeting.
 Source: Federal Reserve Economic Data (FRED)
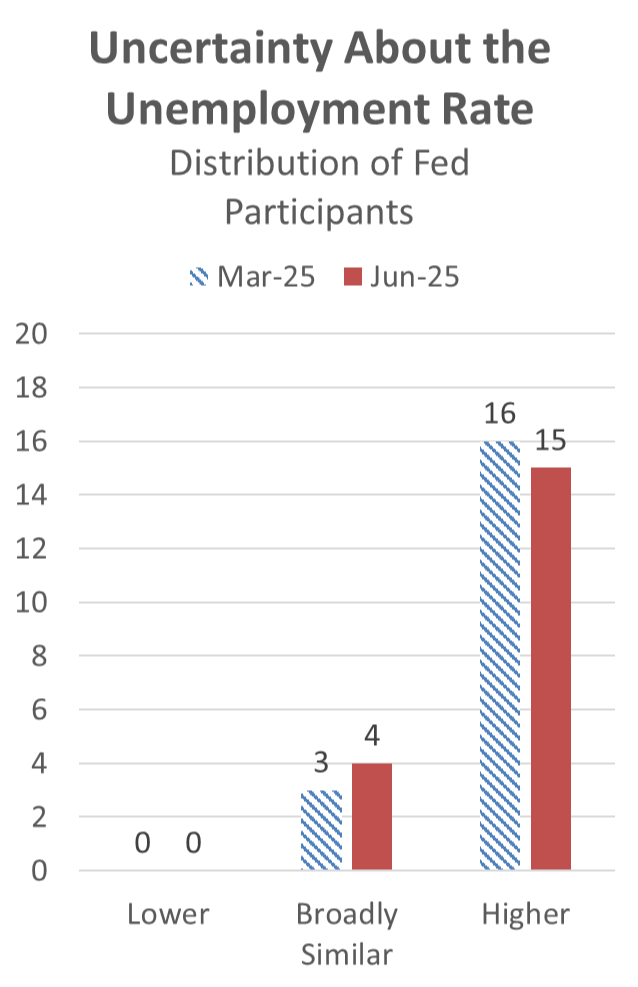
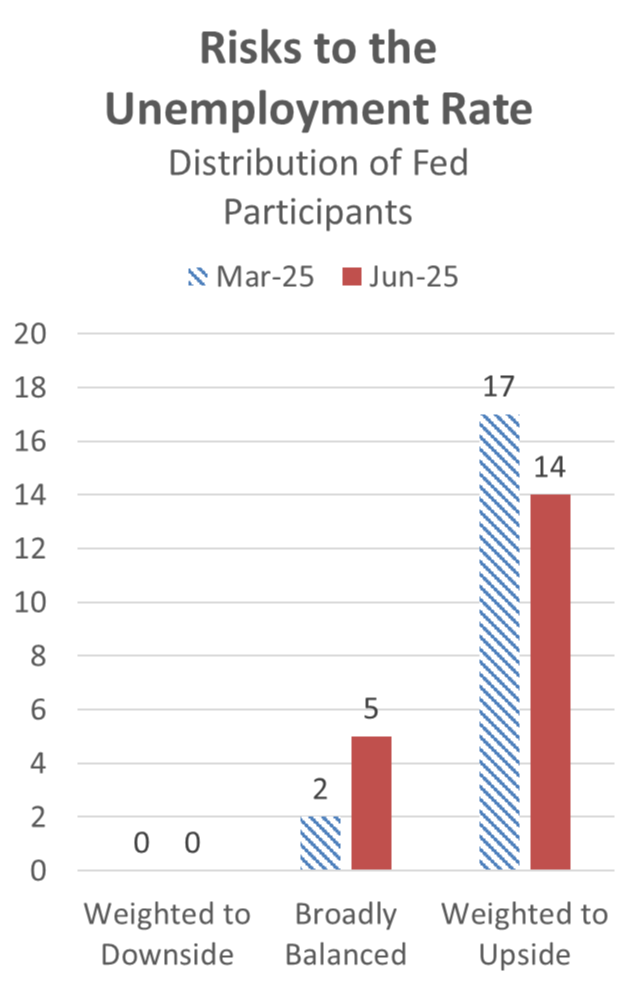
Uncertainty of Fed members around these forecasts has decreased (see charts below), but this was before the latest jobs miss (and lower revisions) and Powell's Jackson Hole comments.
Source: Federal Reserve Economic Data (FRED)
Recent jobs data shows a clear cooling trend. Monthly job creation has declined materially from 2021 peaks, though it remains positive. The three-month moving average of nonfarm payrolls has slowed (see chart below), aligning with the Fed's goal of tempering a hot labor market to avoid reigniting inflation.
However, recent revisions by the Bureau of Labor Statistics revealed fewer jobs created than initially reported, surprising to the downside and potentially pushing unemployment higher.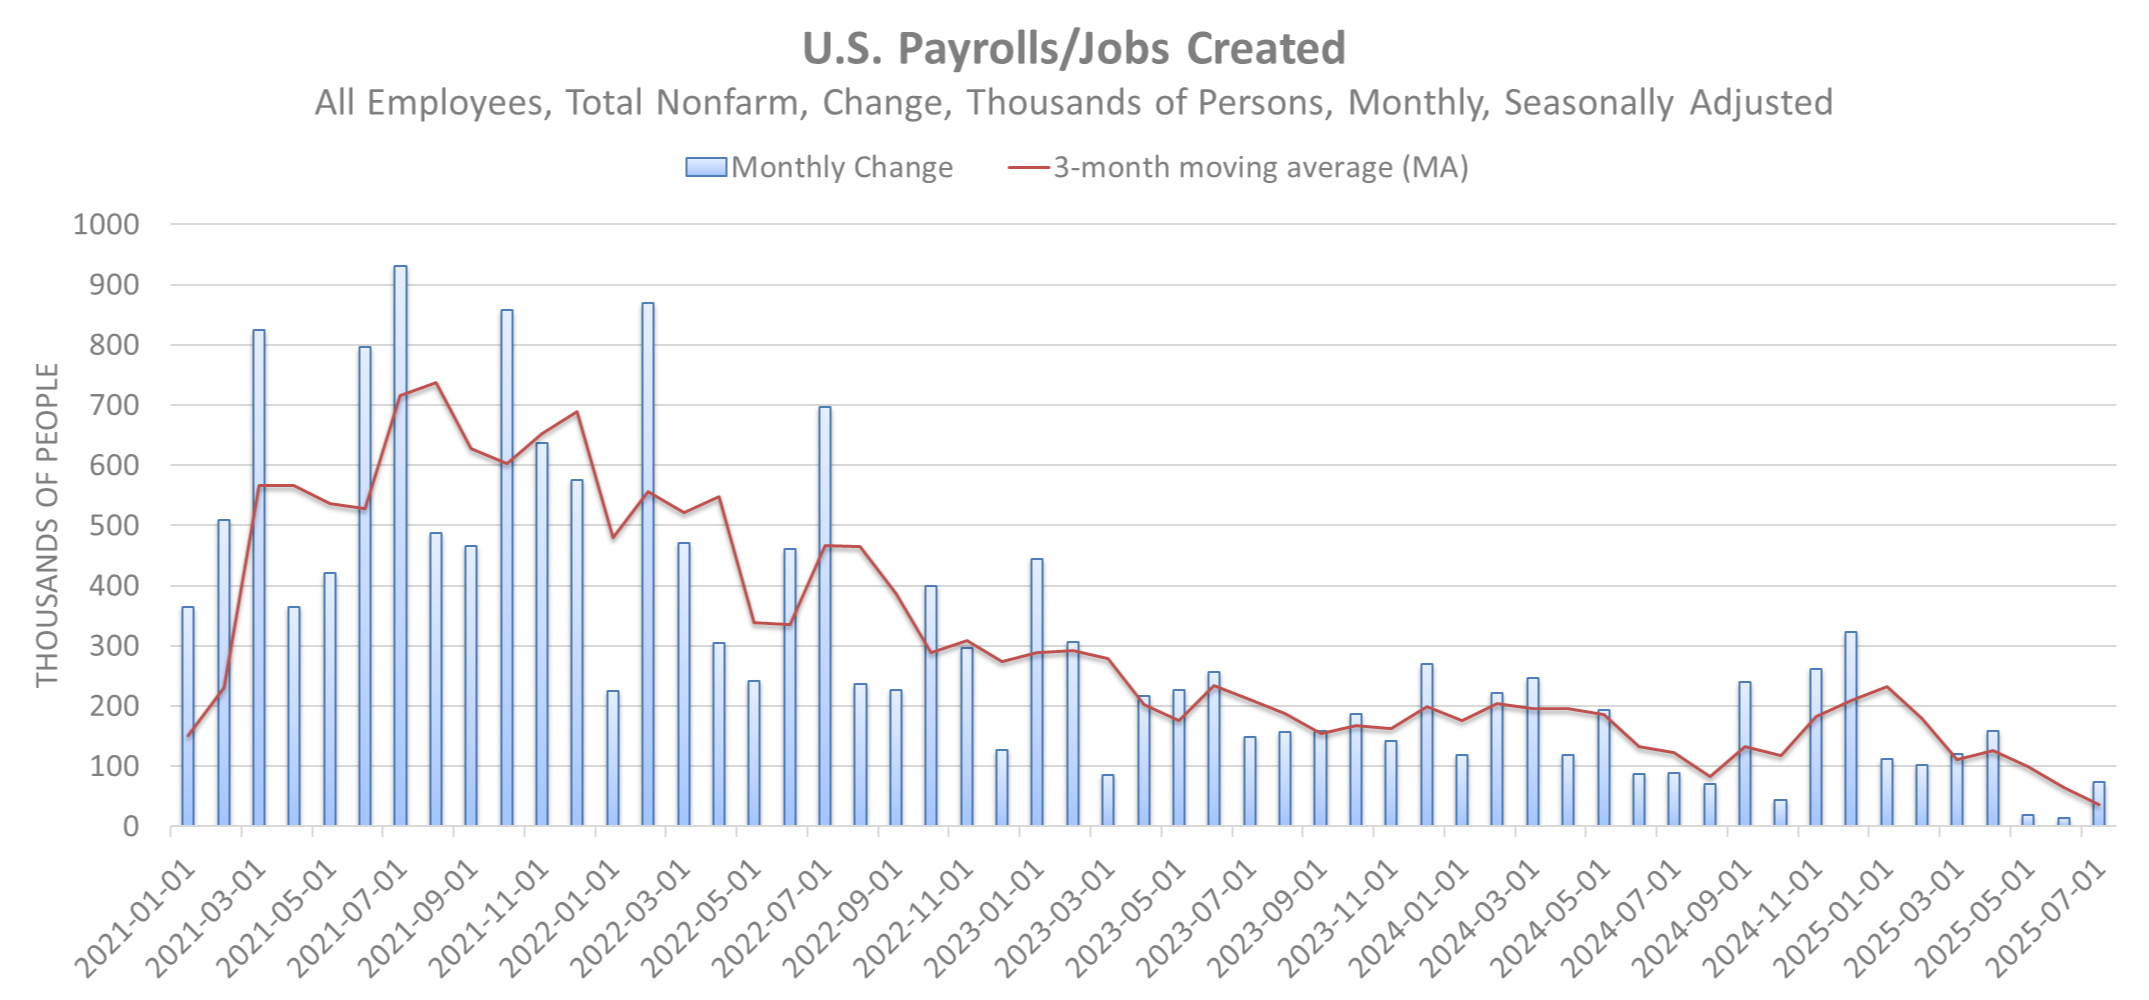
Source: Federal Reserve Economic Data (FRED)
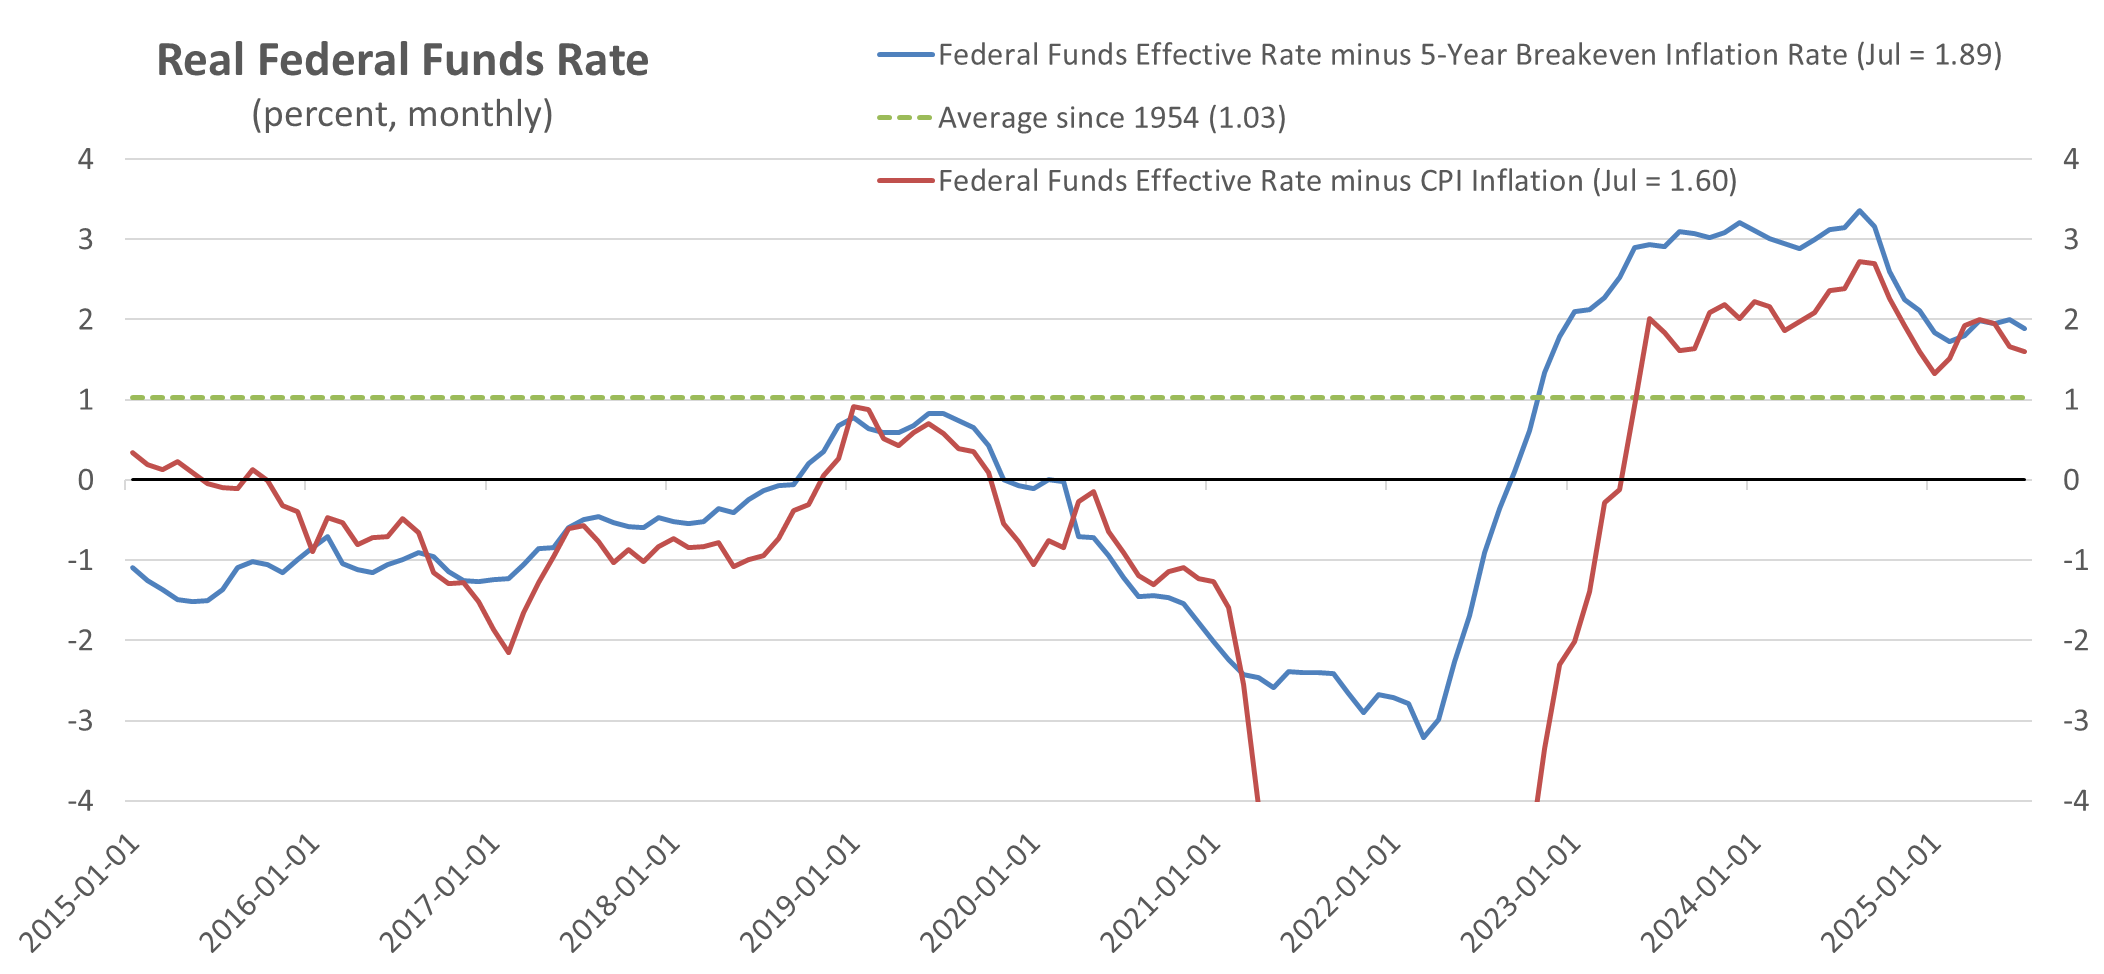
Assessing Restrictiveness: Are Rates Too High?
To gauge if rates are overly restrictive, we can examine the fed funds rate minus inflation (or inflation expectations). Historically, since 1954, this "real" rate has averaged about 1%. Currently:
- Fed funds minus 5-year inflation expectations: ~2.0%
- Fed funds minus current year-over-year inflation: ~1.6%
- Both are above the long-term average, confirming restrictiveness (see chart below).

Source: Federal Reserve Economic Data (FRED)
Another perspective comes from the 2-year Treasury yield. When the fed funds rate exceeds this yield, it often signals impending cuts (see chart below). We're currently in that territory, as seen in late 2023 before prior cuts.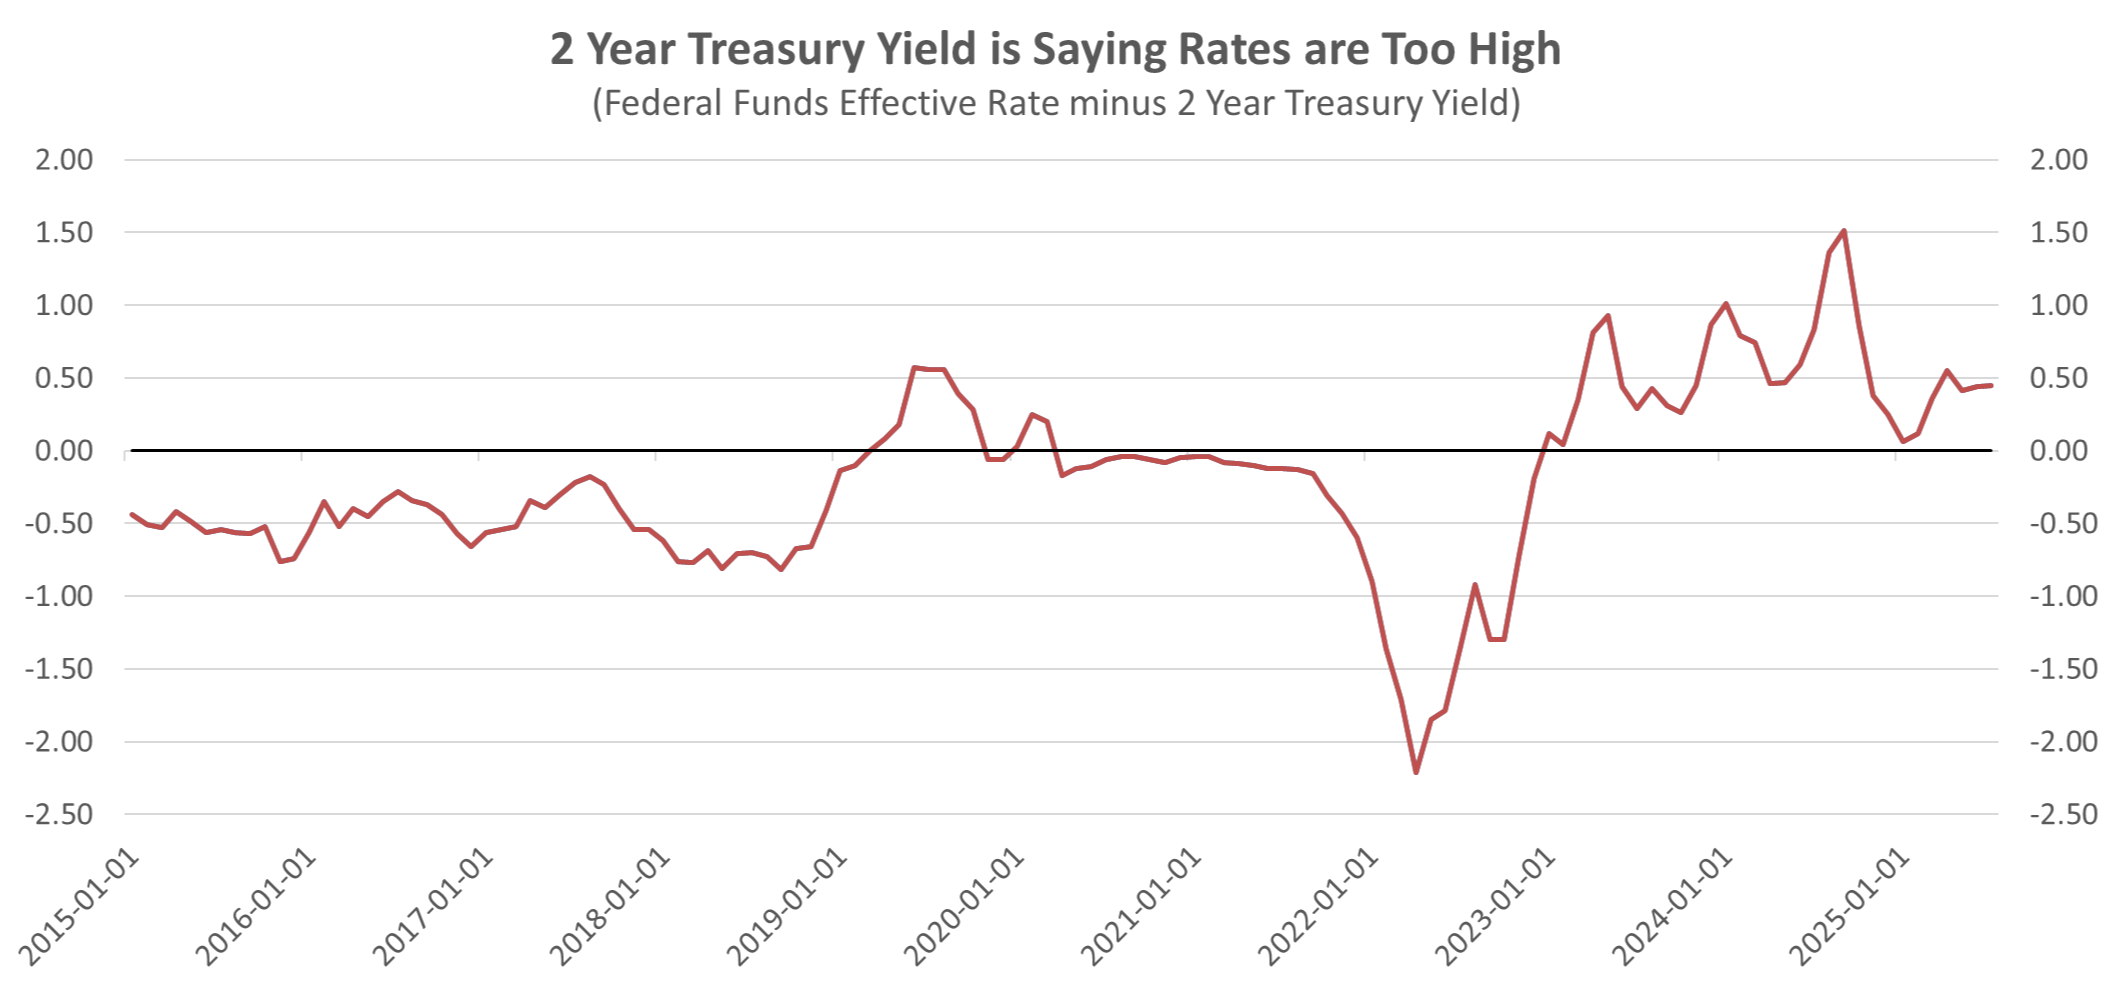
Source: Federal Reserve Economic Data (FRED)
If jobs continue to soften and the unemployment rate rises, the Fed is poised to act, as signaled at Jackson Hole.
Market Expectations for Cuts
At the year's start, markets priced in about two rate cuts by December. Expectations briefly spiked to four amid tariff discussions (now largely resolved via exemptions), but have settled back to two to three (see chart below). I'm leaning toward two, pending upcoming data.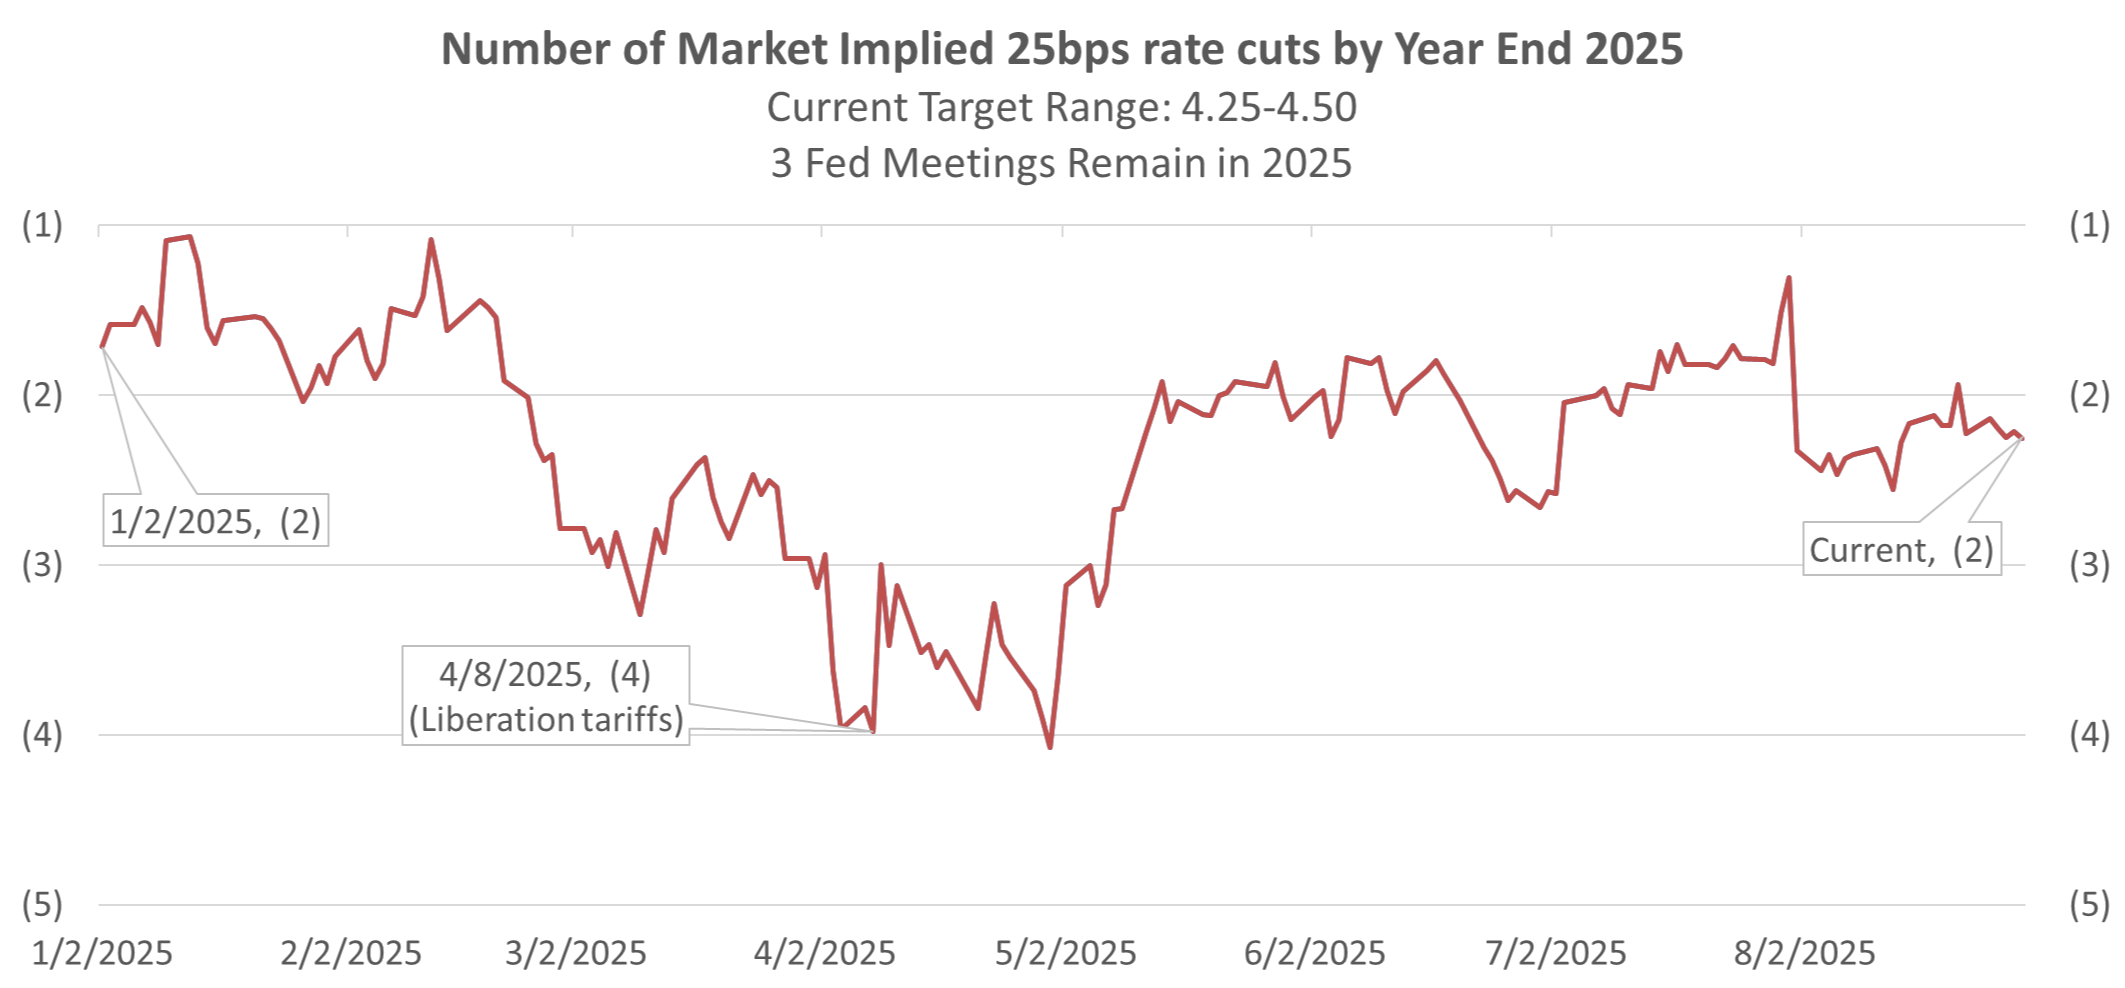
Source: CME Group, as of 8/29/2025
A September cut would align the U.S. with global trends of central banks. 2025 has seen the fastest non-COVID rate-cutting cycle worldwide since 2020, as inflation eases globally (see chart below).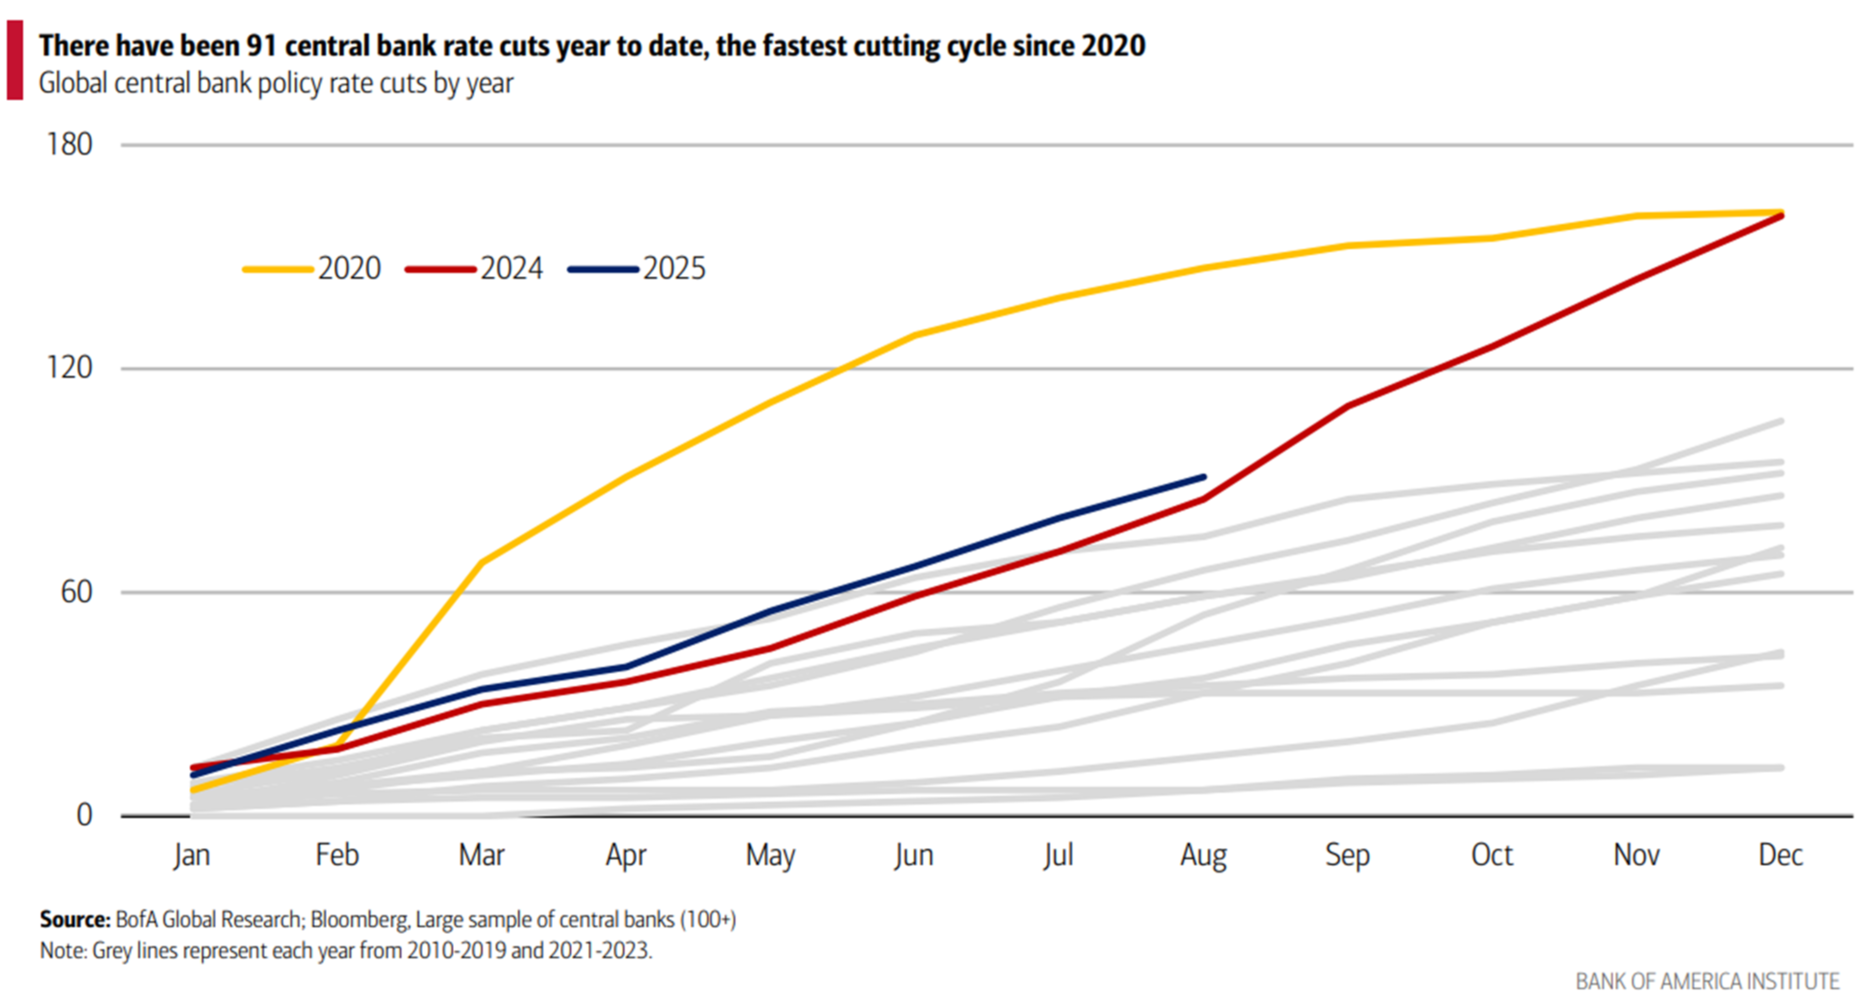
What Does This Mean for Stocks?
A common question: If we cut rates in September, what happens to stocks? History provides encouraging data.
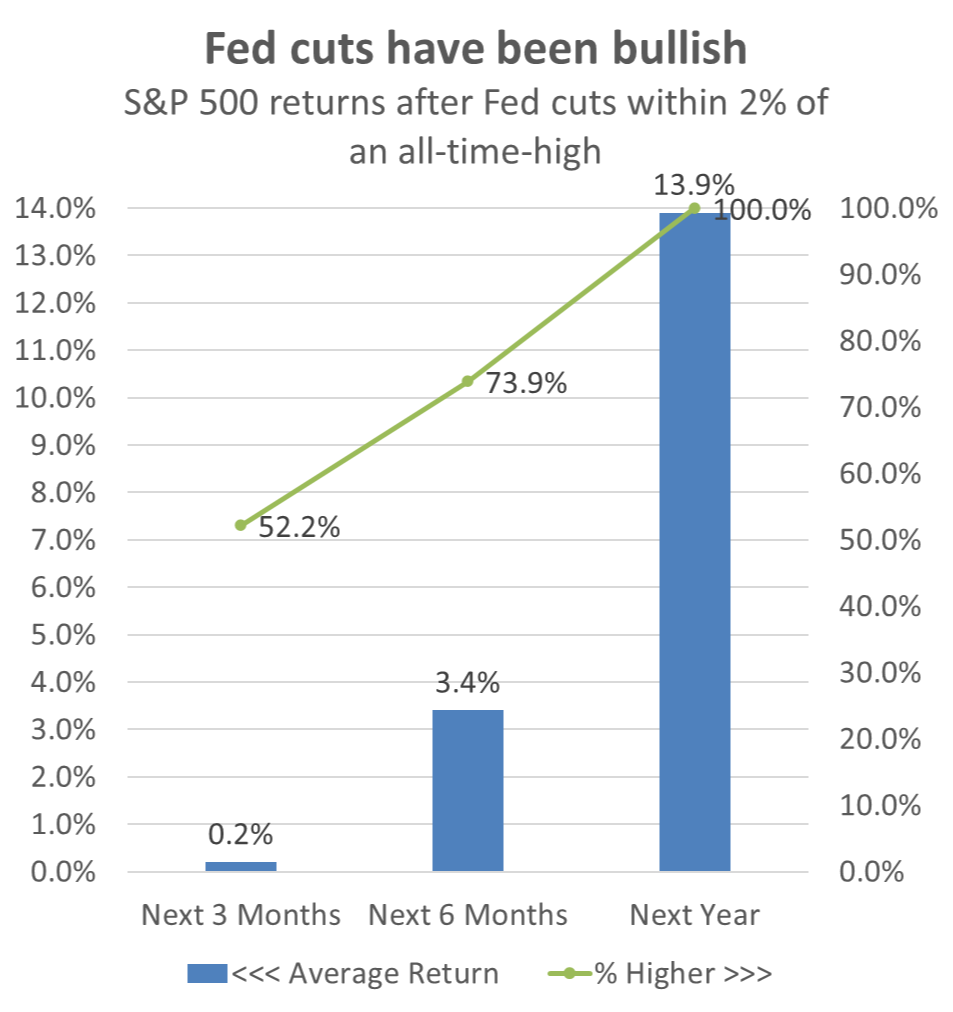
When cuts resume near all-time highs in the S&P 500 (uncommon but not unprecedented), markets typically rally higher afterward—stimulated by easier policy that supports employment and growth (see chart below).
- 3 months later: Average +0.2% (positive in most cases)
- 6 months later: Average +3.4%
- 1 year later: Average +13.9% (higher than typical annual returns), positive 100% of the time historically.
Source: Carson Investment Research
While past performance isn't a guarantee, this bodes well for equities.
Closing Thoughts
August was another solid month, driven by small caps and the Fed's labor-focused pivot at Jackson Hole. With rate cuts likely on the horizon, markets have cheered the prospect of continued stimulus. We'll monitor September's key reports and update you next month.
Thank you for your trust, and we hope you had a wonderful summer and Labor Day. Here's to a great fall season ahead.
Disclosures & Definitions
Index Benchmarks presented within this report may not reflect factors relevant for your portfolio or your unique risks, goals or investment objectives. Past performance of an index is not an indication or guarantee of future results. It is not possible to invest directly in an index.
The Standard & Poor's 500 (S&P 500) is a market-cap weighted index comprised of the common stocks of 500 leading companies in leading industries of the U.S. economy. You cannot invest directly in an index.
The MSCI ACWI (Morgan Stanley Capital International All Country World Index) is a stock index designed to track broad global equity-market performance. Maintained by Morgan Stanley Capital International (MSCI), the index captures large and mid cap representation across 23 Developed Markets (DM) and 24 Emerging Markets (EM) countries. With 2,883 constituents, the index covers approximately 85% of the global investable equity opportunity set. (EM) countries*. With 2,883 constituents, the index covers approximately 85% of the global investable equity opportunity set.
The Bloomberg Aggregate Bond® Index broadly tracks the performance of the U.S. investment-grade bond market. The index is composed of investment-grade government and corporate bonds.
The effective federal funds rate (EFFR) is calculated as a volume-weighted median of overnight federal funds transactions reported in the FR 2420 Report of Selected Money Market Rates. The New York Fed publishes the EFFR for the prior business day on the New York Fed's website at approximately 9:00 a.m
The Federal Open Market Committee (FOMC) is the branch of the Federal Reserve System that determines the direction of monetary policy. The FOMC has 12 voting members, including all seven members of the Board of Governors and a rotating group of five Reserve Bank presidents. The Chair of the Board of Governors also serves as Chair of the FOMC.
FRED (Federal Reserve Economic Data) is an online database consisting of hundreds of thousands of economic data time series from scores of national, international, public, and private sources.
The Consumer Price Index (CPI) is a measure of the average change over time in the prices paid by urban consumers for a market basket of consumer goods and services.
The Bureau of Labor Statistics (BLS) is an agency of the United States Department of Labor. It is the principal fact-finding agency in the broad field of labor economics and statistics and serves as part of the U.S. Federal Statistical System. BLS collects, calculates, analyzes, and publishes data essential to the public, employers, researchers, and government organizations.
Advisory Persons of Thrivent Advisor Network provide advisory services under a “doing business as” name or may have their own legal business entities. However, advisory services are engaged exclusively through Thrivent Advisor Network, LLC, a registered investment adviser. RetirePath Advisors and Thrivent Advisor Network, LLC are not affiliated companies. Information in this message is for the intended recipient[s] only. Please visit our website www.retirepathadvisors.com for important disclosures.
Securities offered through Thrivent Investment Management Inc. (“TIMI”), member FINRA and SIPC, and a subsidiary of Thrivent, the marketing name for Thrivent Financial for Lutherans. Thrivent.com/disclosures. TIMI and RetirePath Advisors are not affiliated companies.