

As we step into 2026, it's the perfect time to reflect on the market performance of 2025—a year that delivered strong returns across nearly all asset classes despite some notable volatility along the way. In this update I’ll cover the key events that shaped the year of 2025.
2025 Asset Class Returns: A Strong Year Overall
2025 turned out to be a rewarding year for diversified investors:
- International Stocks: The standout performer, delivering approximately 32-33% returns. This was boosted by currency gains against the US dollar, positive policy changes in Japan, and potential increased fiscal spending in Europe.
- S&P 500 (US Large Caps): Up around 18% for the year.
- US Small Caps: Solid double-digit gains at about 13%.
- Bonds: Often called "boring," but they shone with returns of just over 7%.
- Cash: Delivered over 4% with zero volatility—beating inflation comfortably but trailing all other major asset classes.
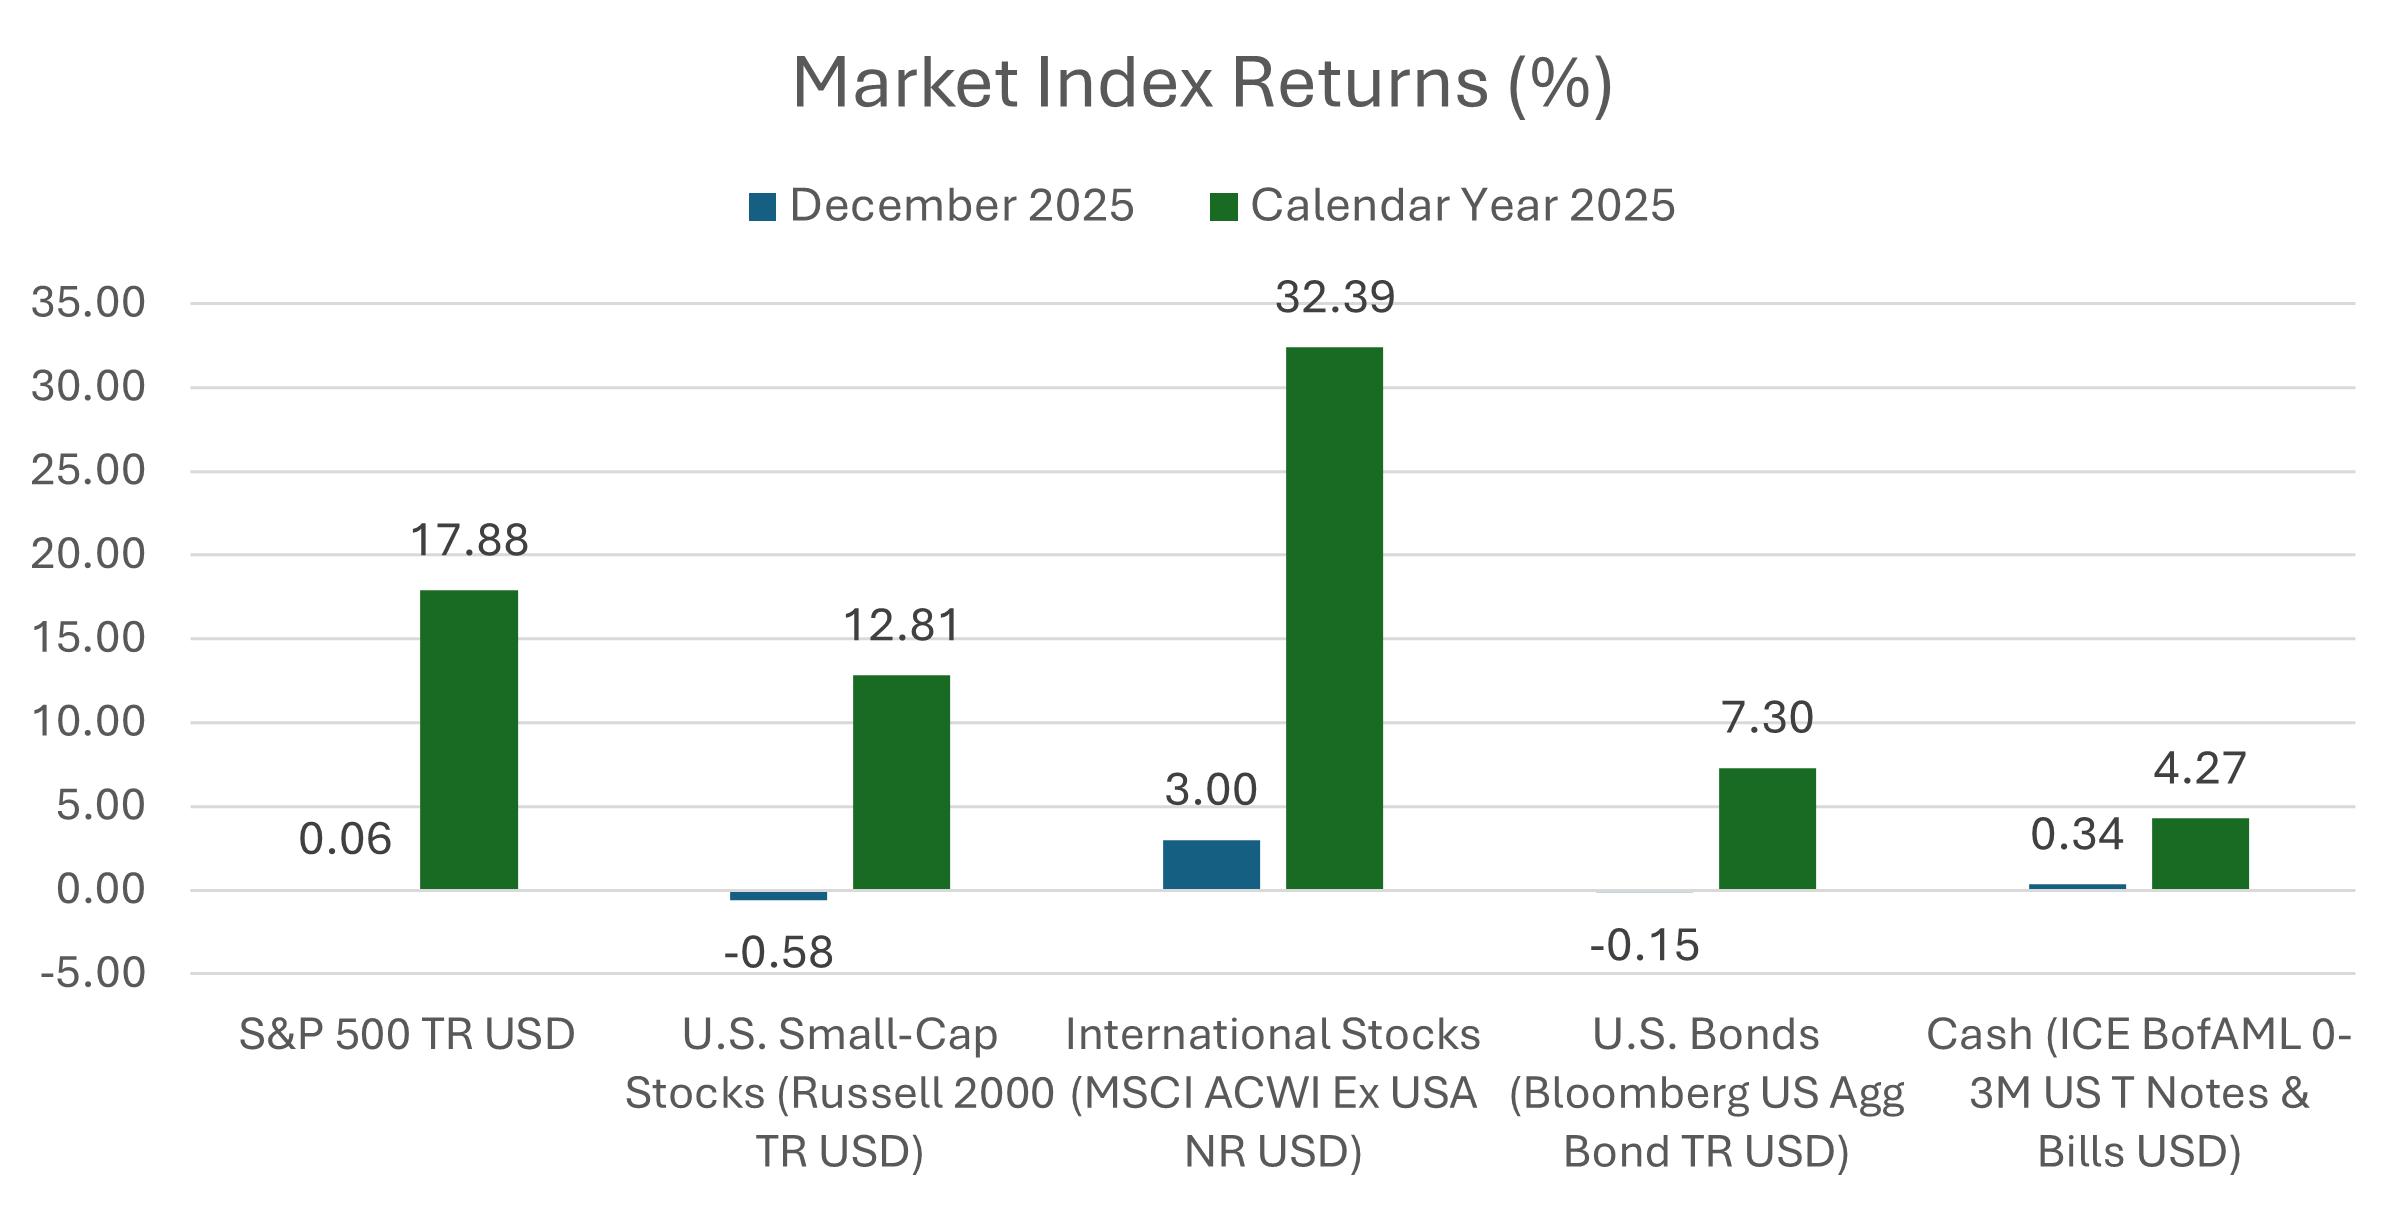

Source: Morningstar Direct as of 12/31/2025
In short, every major category we track posted positive returns, with stocks (both domestic and international) and even bonds outperforming cash. It was a great reminder of the benefits of staying invested through the ups and downs.
For December specifically:
- The S&P 500 eked out a small positive gain, marking eight consecutive positive months—an impressive streak dating back to the volatility spike in April.
- International stocks closed the month strong, up over 3%, continuing their leadership for the year.
Key Themes That Shaped 2025
While the headlines might suggest turbulence, the markets proved resilient. Here are the three major themes that defined the year:
- Tariffs and Early-Year Volatility The year started calmly, but April brought significant disruption when tariff rates skyrocketed—reaching an effective rate of over 30% at one point, particularly impacting trade with China. Markets reacted swiftly, with stocks dropping about 12% in a matter of days as investors priced in potential hits to GDP, corporate earnings, and inflation.
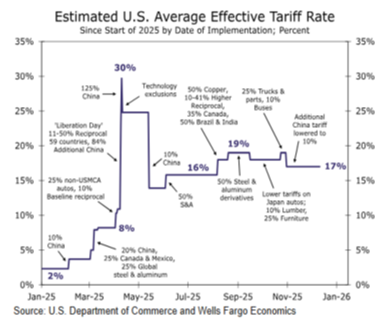
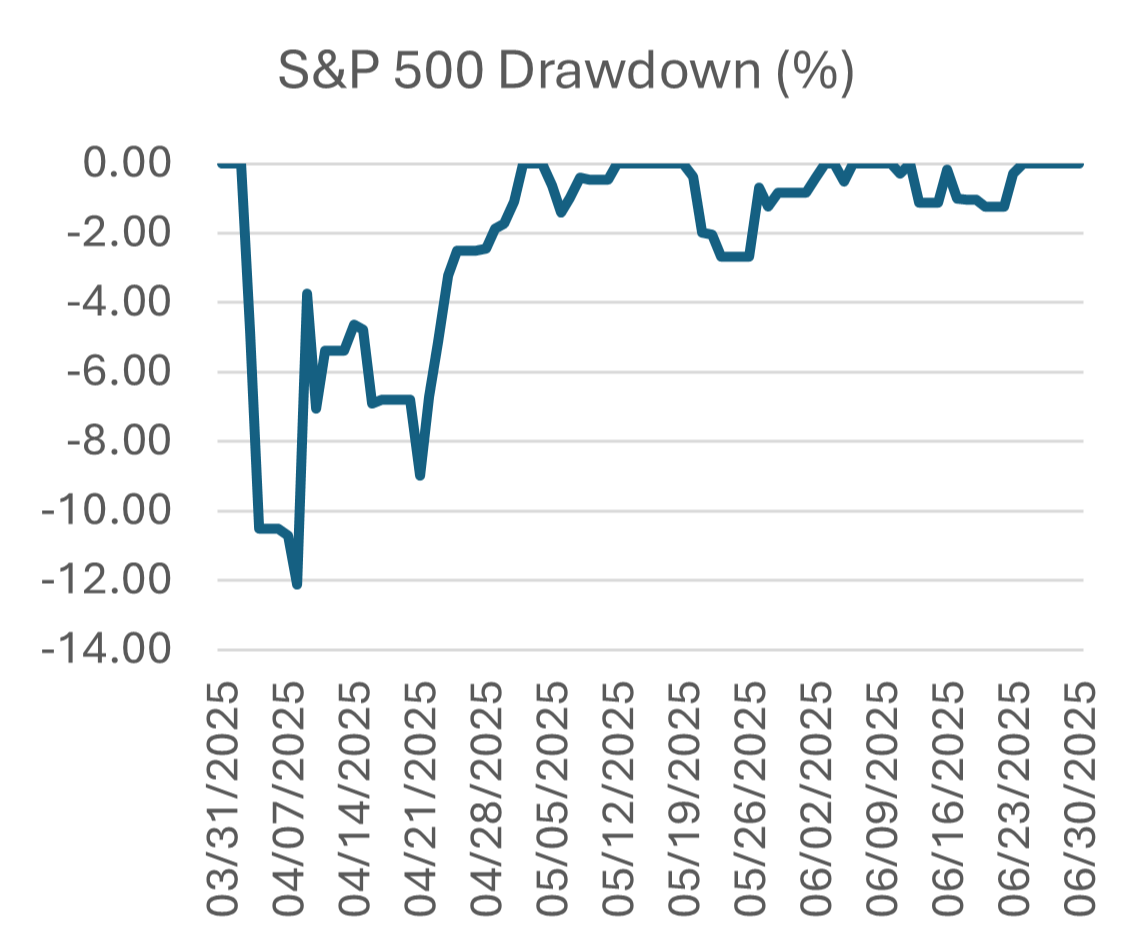


Source: Wells Fargo Economics, Morningstar Direct as of 6/30/2025
Fortunately, cooler heads prevailed. Exemptions were granted for critical industries (like semiconductors), and the effective tariff rate settled around 16% by summer. This was largely viewed in hindsight as a negotiating tactic that achieved key objectives. Stocks recovered quickly, reaching new highs by the end of Q2 and closing the year on a strong note.
- Inflation Remained Sticky but Manageable Higher tariffs did push up goods inflation (many imported items saw price increases after years of deflation). However, this was offset by cooling services inflation, slowing wage growth, and decelerating housing costs (dropping from over 8% early in the cycle to under 4% by year-end). Overall CPI stayed elevated but never spiraled out of control—remaining in a "yellow light" zone rather than red-hot.
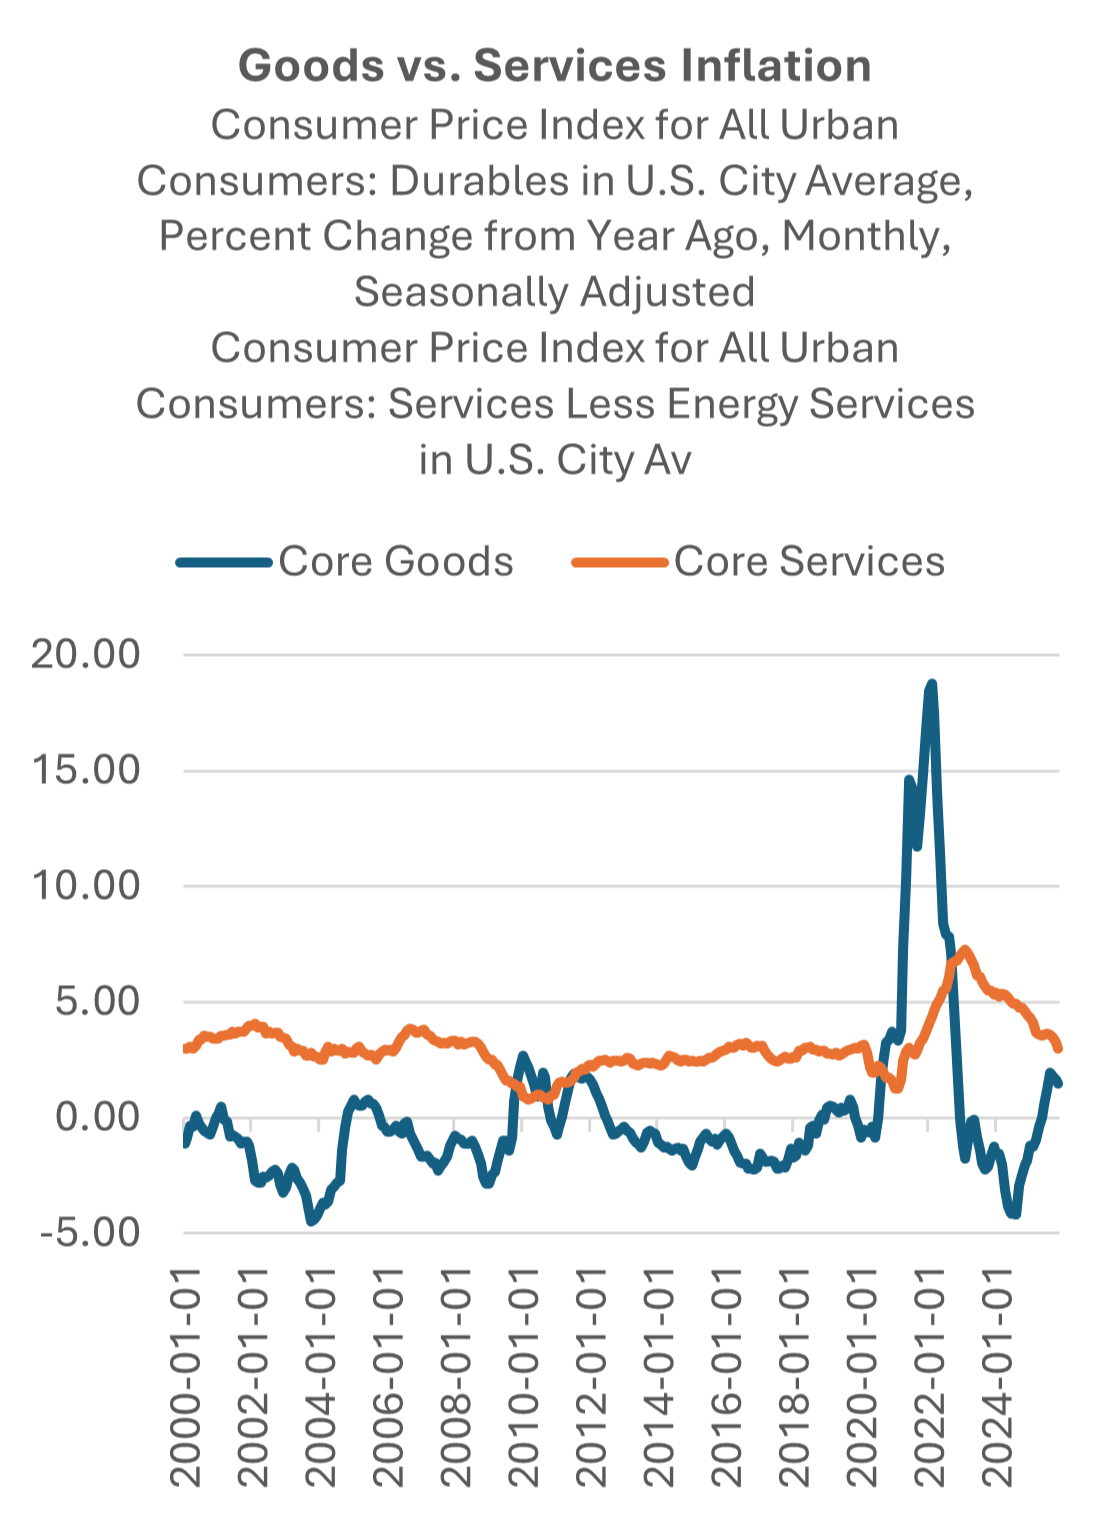
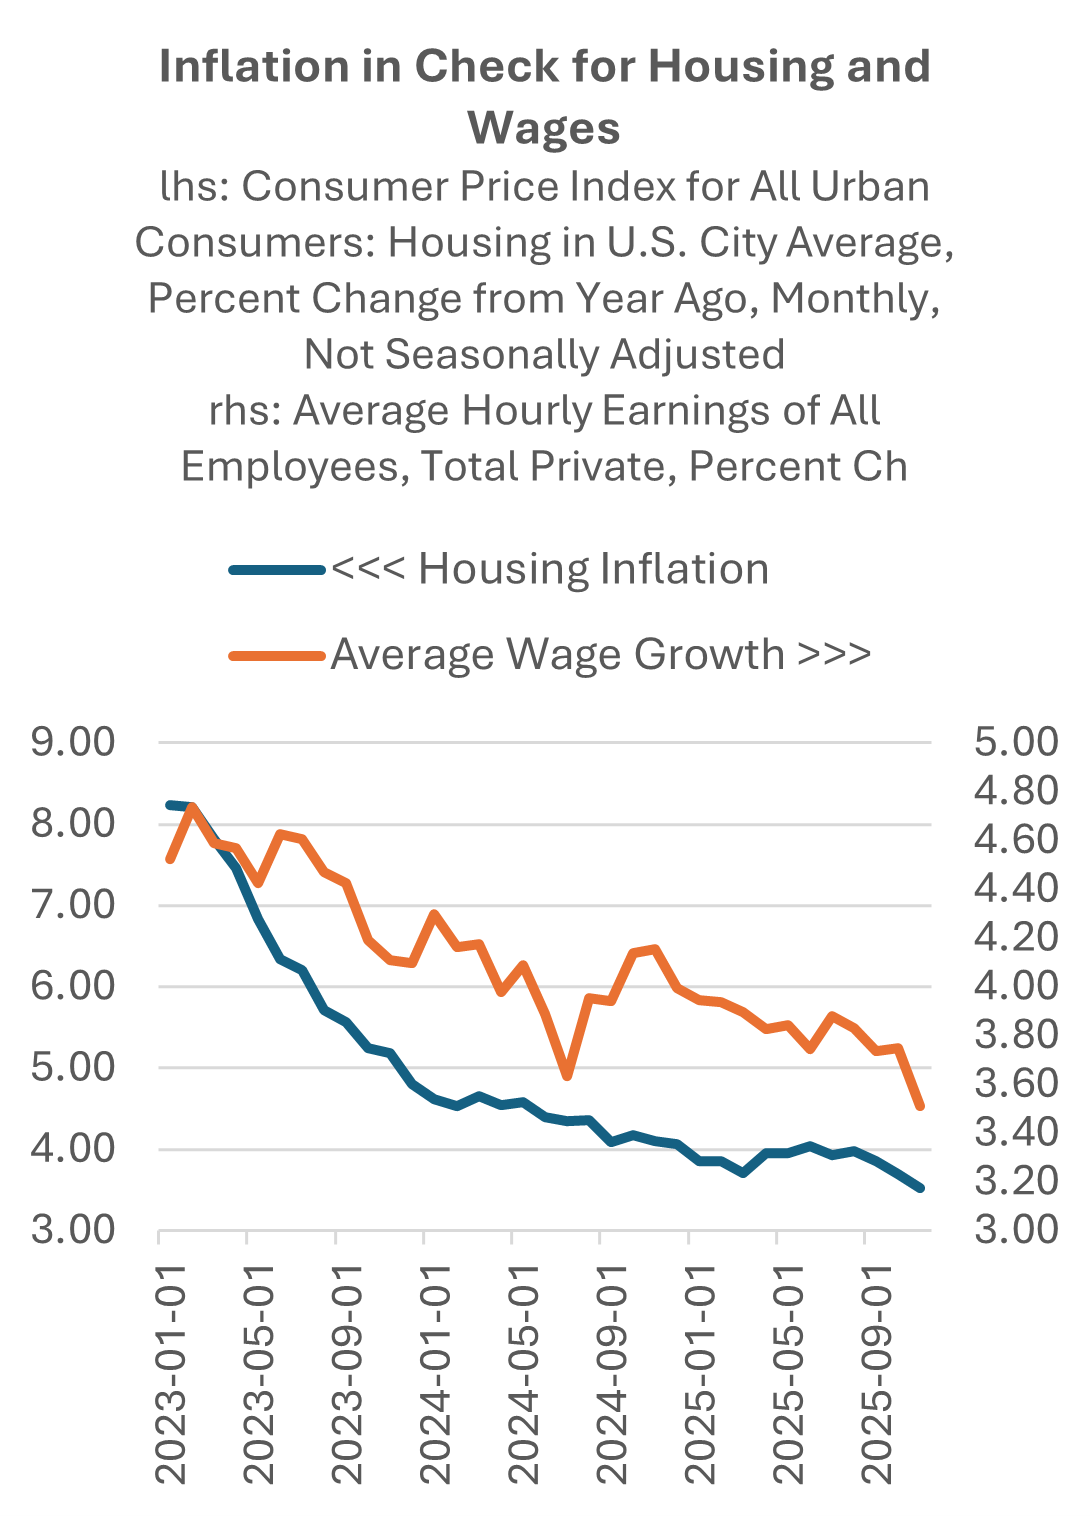
Source: Federal Reserve Economic Research
- The Fed's Timely Pivot With inflation stable (if sticky) and the labor market cooling—unemployment ticking higher and job growth slowing—the Federal Reserve shifted focus. At Jackson Hole, they signaled a greater emphasis on supporting employment, leading to well-timed rate cuts that provided relief without reigniting inflation fears.
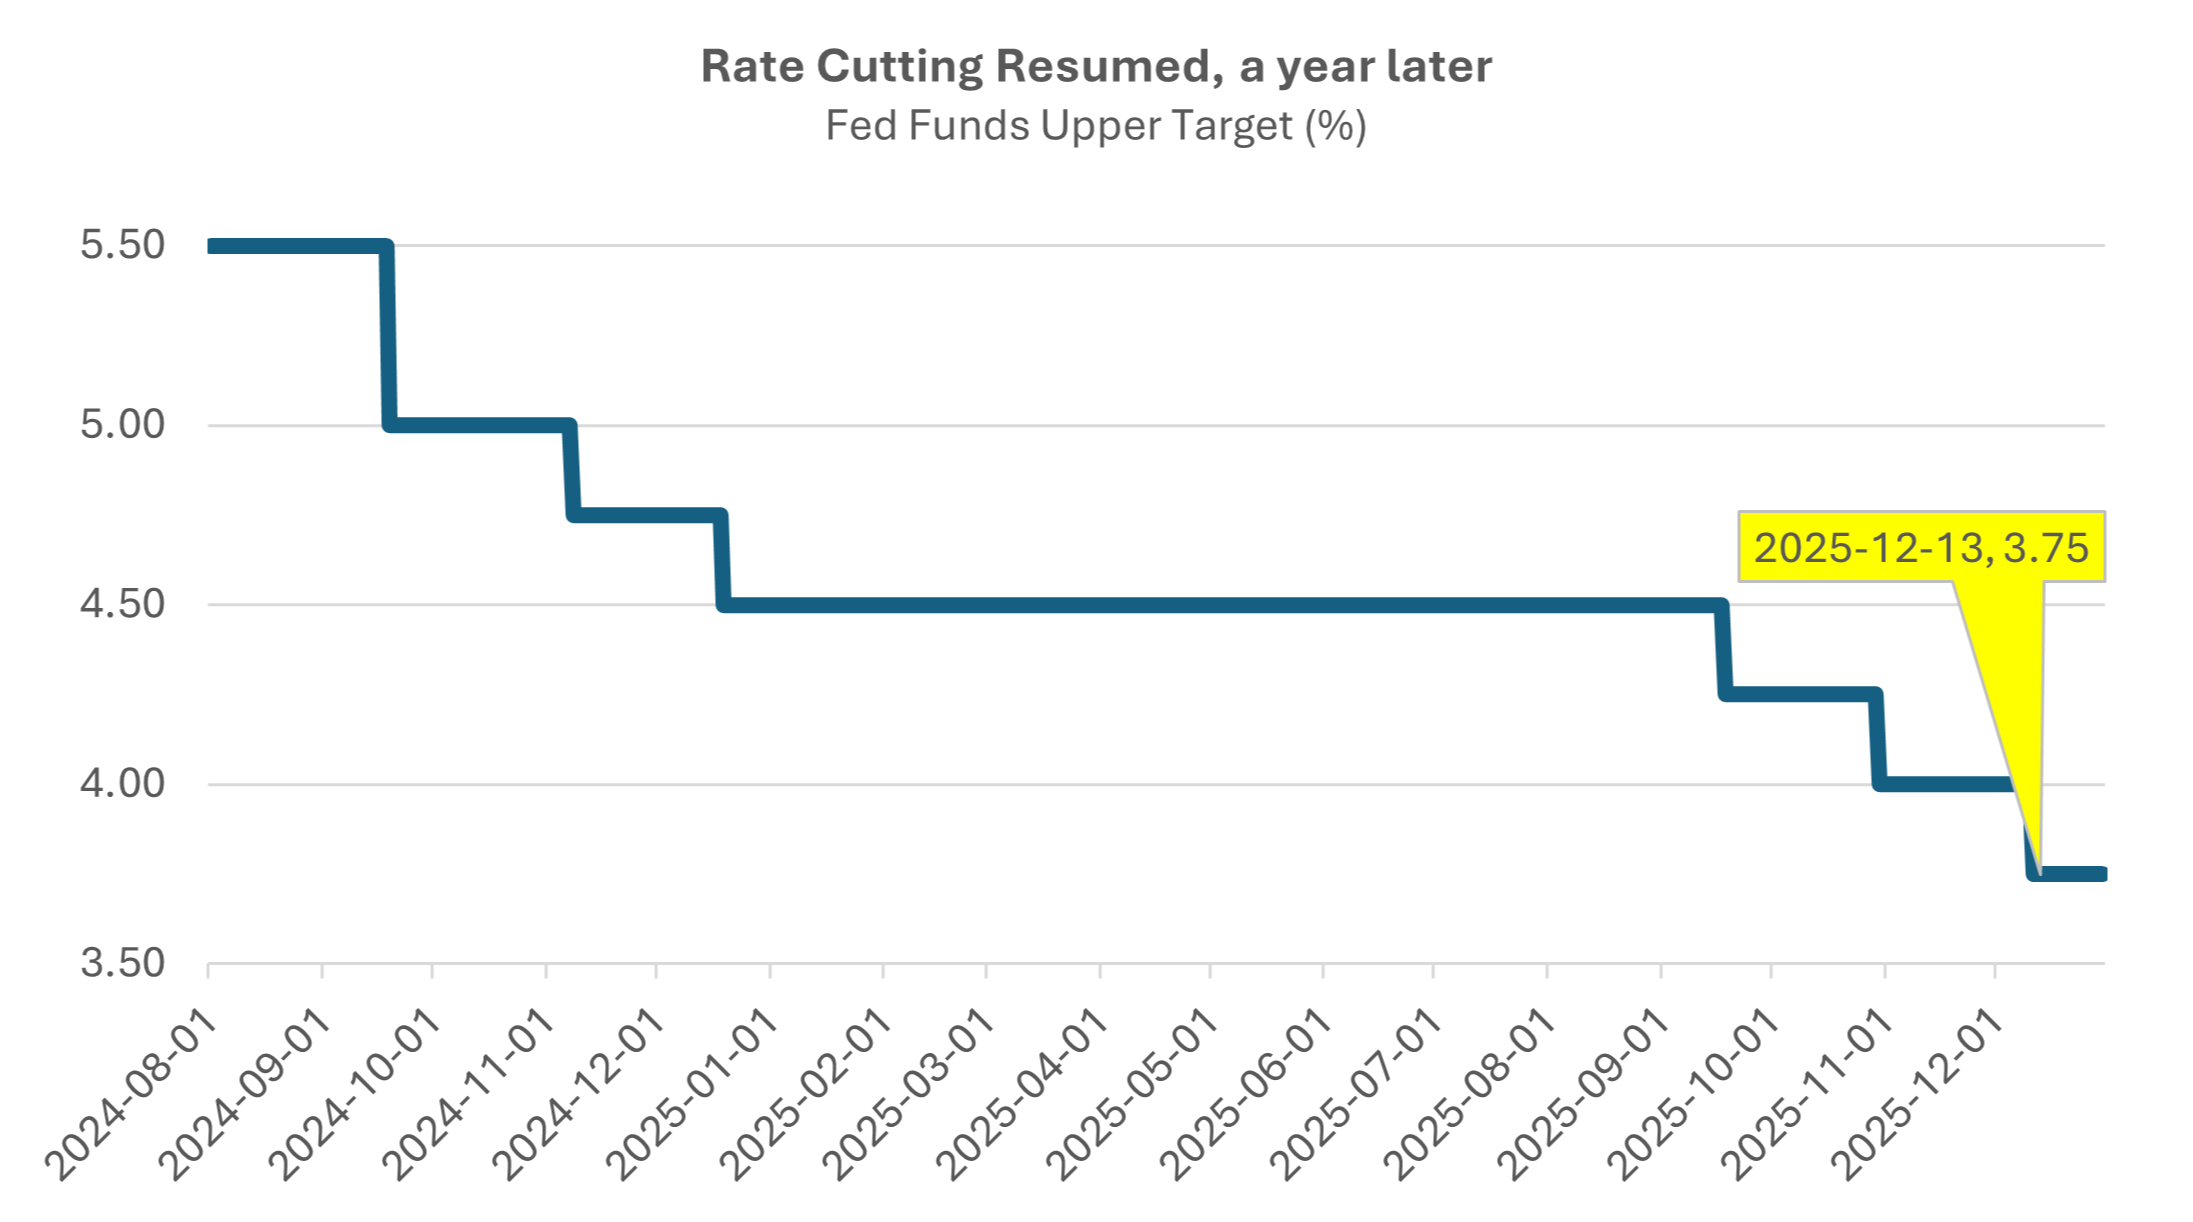

Source: Federal Reserve Economic Research
These factors combined to support record corporate earnings, stable profit margins, and a rebound in GDP growth, powering the market's resilience (see both charts below, as corporate earnings soared and GDP rebounded in Q2 and Q3).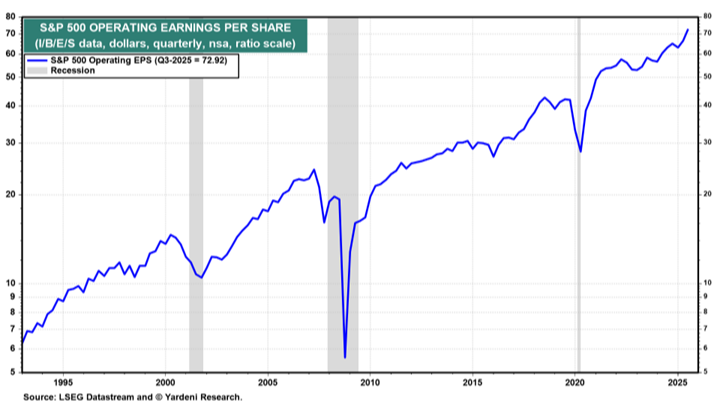
Source: Yardeni Research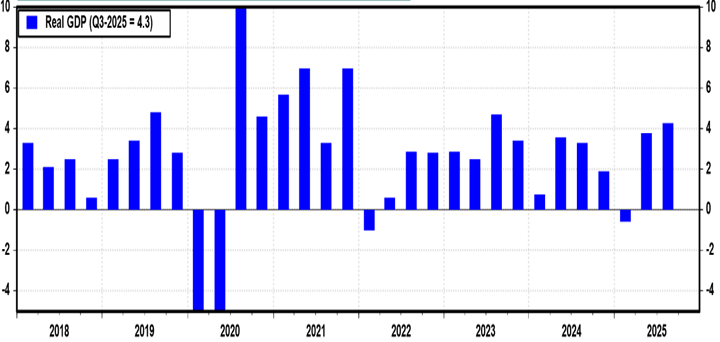
Source: Yardeni Research
Looking Ahead
2025 demonstrated once again that markets can navigate policy shifts, geopolitical tensions, and economic uncertainty while delivering solid long-term results for patient investors. Diversification paid off, and staying the course through the April dip would have been handsomely rewarded.
If you're planning for retirement or simply want to stay informed on market trends, I encourage you to watch the full video breakdown here: Market Memo December 2025.
While diversification can help reduce market risk, it does not eliminate it. Diversification does not assure a profit or protect against loss in a declining market.
Index Benchmarks presented within this report may not reflect factors relevant for your portfolio or your unique risks, goals or investment objectives. Past performance of an index is not an indication or guarantee of future results. It is not possible to invest directly in an index.
The S&P 500® Index, or the Standard & Poor's 500® Index, is a market-capitalization-weighted index of the 500 largest U.S. publicly traded companies.
The Russell 2000® Index measures the performance of the 2,000 smaller companies that are included in the Russell 3000® Index, which itself is made up of nearly all U.S. stocks. The Russell 2000® is widely regarded as a bellwether of the U.S. economy because of its focus on smaller companies that focus on the U.S. market.
The MSCI ACWI (Morgan Stanley Capital International All Country World Index) Ex-U.S.® Index is a stock market index comprising of non-U.S. stocks from 22 developed markets and 24 emerging markets.
The Bloomberg Aggregate Bond® Index broadly tracks the performance of the U.S. investment-grade bond market. The index is composed of investment-grade government and corporate bonds.
Gross domestic product (GDP) is the total monetary or market value of all the finished goods and services produced within a country’s borders in a specific time period. As a broad measure of overall domestic production, it functions as a comprehensive scorecard of a given country’s economic health.
The Consumer Price Index for All Urban Consumers (CPI-U) is a monthly measure of the average change over time in the prices paid by consumers for a market basket of consumer goods and services.