


Quality Stock Fundamentals in the Age of High Spending for Artificial Intelligence
The Magnificent 7 and Their Beneficiaries
What We Mean by Quality
Some of the best businesses share a common set of characteristics. They earn high returns on what they own. They generate strong returns for shareholders without relying heavily on borrowed money. And they do it consistently — not just in one good year, but across economic cycles and competitive shifts. That combination is what we mean when we talk about quality.
Warren Buffett has described his approach as buying "wonderful companies at fair prices" — businesses with durable competitive advantages, high returns on equity, and minimal dependence on debt. The underlying logic is straightforward: a business that earns 25% on equity, year after year, funded primarily by its own profits, compounds wealth at a rate that is genuinely difficult to replicate through financial engineering or market timing. Academic research has confirmed what Buffett practiced intuitively. Studies spanning decades of market data have found that high-quality stocks — defined by profitability, earnings power, and financial safety — have outperformed their lower-quality counterparts over the long run, across multiple market cycles. Quality does not just reduce risk. It generates return.
Sources: Warren Buffett, Berkshire Hathaway Annual Letter to Shareholders (1989); Asness, Frazzini, and Pedersen, "Quality Minus Junk," AQR Capital Management (2013; published Review of Accounting Studies, 2019).
The reason to measure quality systematically, rather than relying on reputation or narrative, is that quality changes. A company that was a high-quality compounder five years ago may not be one today — and the market is often slow to recognize the shift. Rising leverage, declining asset efficiency, or eroding earnings consistency are early warnings that frequently precede deteriorating fundamentals and stock price moves. Our framework tracks four signals each quarter, scored against the full S&P 500, to detect exactly those changes.
The Four Quality Signals
Return on Assets: How much profit the business generates from everything it owns — factories, technology, inventory, intellectual property. A high and stable ROA can indicate efficient capital deployment. A declining ROA often signals competitive erosion or overcapacity.
Return on Equity: The return generated specifically for shareholders. Buffett has long emphasized ROE as the essential test of management effectiveness. A business consistently earning 20–30% ROE without achieving it through excessive leverage is almost always doing something fundamentally right.
Financial Leverage: How much borrowed money the business relies on. Quality businesses tend to fund operations from their own earnings, not debt. Low leverage can create resilience when conditions deteriorate. Rising leverage, without proportional earnings growth, is a signal worth watching.
Earnings Stability: Consistency over time. A business that earns high returns in one year but swings widely across cycles is a very different proposition from one that delivers steady results. We measure this over a rolling 36-month window to capture genuine business characteristics, not single-period noise.
These four signals are combined into a single composite score and compared against every other company in the S&P 500 at each quarter-end. A score above zero indicates above-average quality. A score above 1.0 typically places a company in the top 15–20% of the index.
The Magnificent 7 Through a Quality Lens
The four largest cloud providers committed over $300 billion to AI infrastructure in 2025 (Source: company earnings disclosures and investor guidance, Microsoft, Alphabet, Meta, and Amazon Q4 2024 / Q1 2025 capex announcements). Microsoft, Alphabet, Meta, and Amazon have been building data centers, acquiring companies, and laying the groundwork for a generational technology shift. What that spending is doing to their balance sheets — and to their quality as businesses — is worth examining carefully. The story is more nuanced than the headlines suggest, and it extends well beyond the hyperscalers themselves.
Key Takeaways
→ Each hyperscaler is on a different trajectory. Treating them as a group is a mistake.
→ Alphabet's profitability is at five-year highs — but its leverage has doubled in three quarters.
→ Semiconductor equipment names (LRCX, AMAT, KLAC) are capturing the capex tailwind without taking on the debt.
→ Micron and Western Digital have staged a dramatic recovery — but those gains depend entirely on continued AI demand.
The Hyperscalers: Quality Diverges as Leverage Increases
The four hyperscalers have moved in very different directions over the past five years. On quality, they've spread apart. On leverage, two names have improved while two others have taken on significant new debt.
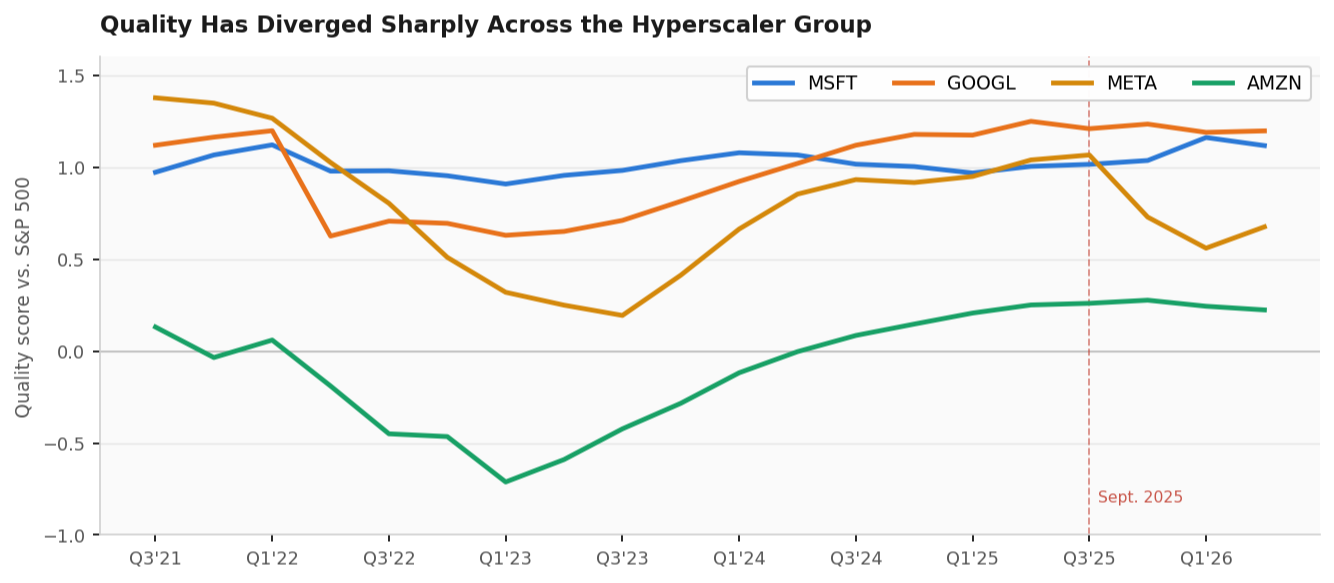
Scores above zero indicate above-average S&P 500 quality. Dashed line marks September 2025, when quality metrics began a measurable inflection across the group. Source: Morningstar, as of June 30, 2026.
Microsoft has been the steadiest — quality near the 96th S&P 500 percentile for five years, barely moving in either direction. Amazon had the roughest stretch: the only name to drop below average in 2023 as logistics costs overwhelmed profitability, but it has recovered to around the 73rd percentile. Meta fell the furthest — from near the top of the S&P 500 to the 20th percentile during the Metaverse years — and has since climbed back to the 89th. Alphabet is the standout: quality near the 97th percentile, even as its capital structure has shifted significantly.
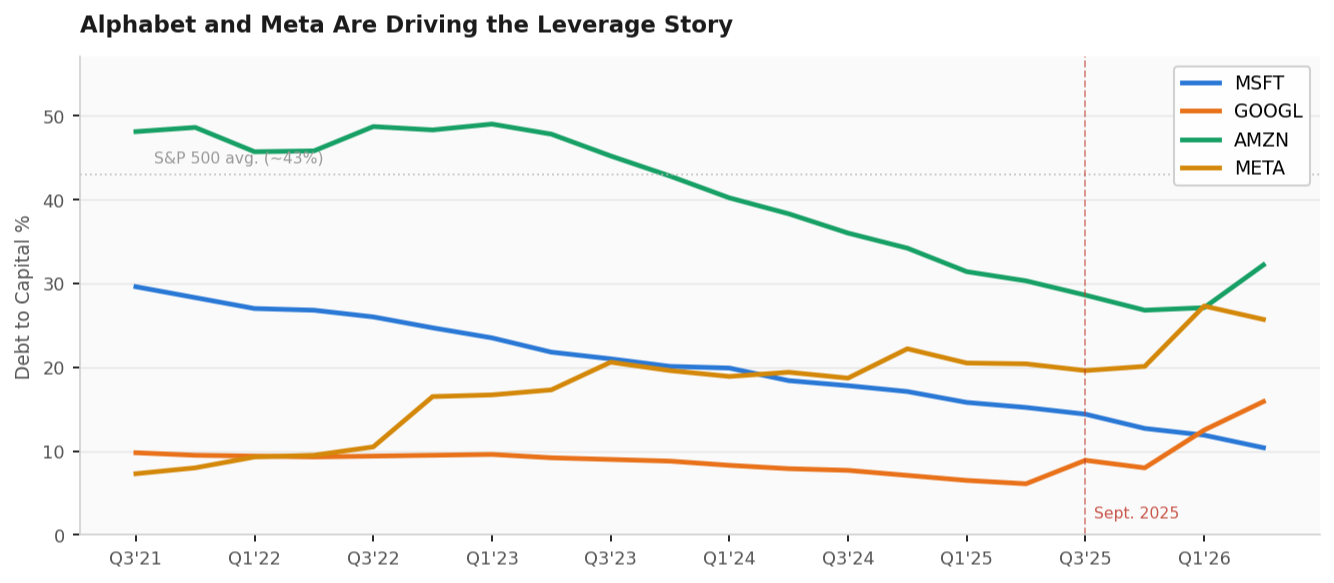
Dotted line marks the approximate S&P 500 Debt to Capital average of ~43%. Source: Morningstar, as of June 30, 2026.
The leverage chart splits the group in two. Microsoft cut its Debt to Capital from 29.6% to 10.4% over this period — building at scale while actually improving its balance sheet. Amazon has done the same over the long run, though a recent uptick from 27% to 32% is worth watching. On the other side, Alphabet has more than doubled its leverage in just three quarters — from 6% in early 2025 to 16% by June 2026 — as it committed to a $75 billion capex program and a major acquisition. Meta has tripled its leverage since 2021, from 7% to 26%. Both are making large bets. Whether those bets pay off in the quality numbers is a question for 2027 and beyond.
The Alphabet Divergence
ROA 27.2% · ROE 38.9% (five-year highs)
Debt to Capital: 6.1% (Apr 2025) → 15.9% (Jun 2026) — doubled in three quarters
Whether the capex translates into higher returns or balance sheet pressure will take two to three years to answer.
Apple, NVIDIA, Tesla: Three Completely Different Stories
The three remaining Mag 7 names follow entirely different trajectories — and tell three of the more interesting business stories in the index right now.
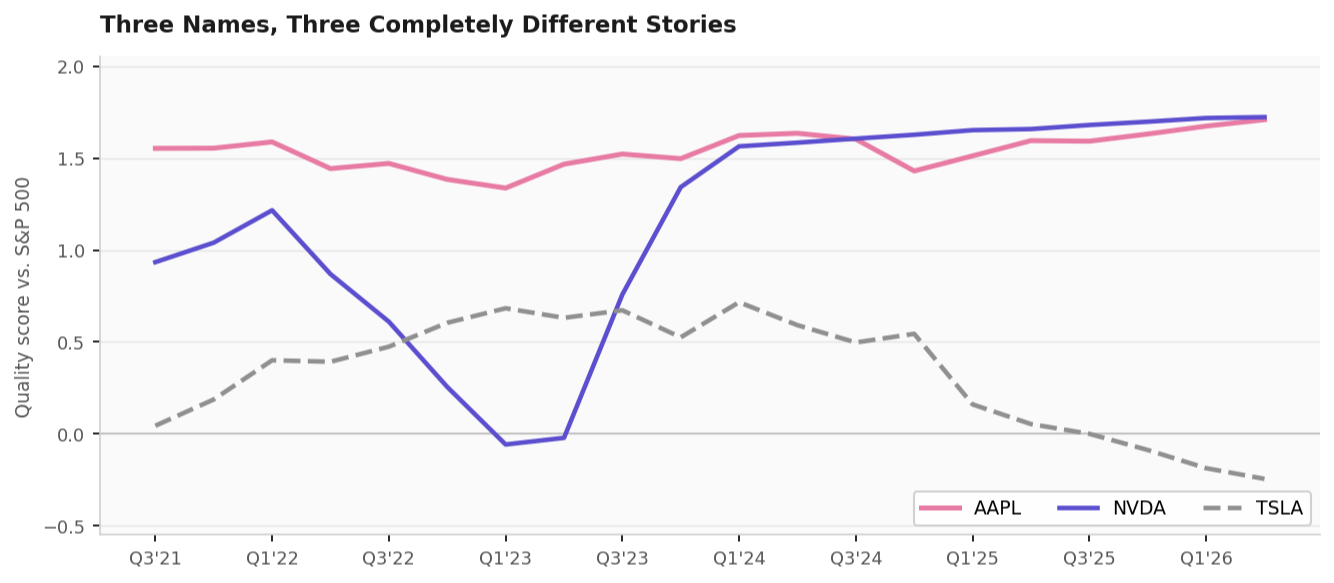
Apple (solid), NVIDIA (solid), Tesla (dashed). Scores measured cross-sectionally against the full S&P 500 universe each quarter. Source: Morningstar, as of June 30, 2026.
Apple hasn't fallen below the 90th S&P 500 quality percentile in five years. It currently sits at the 100th. That consistency across a period that included rate hikes, a tech selloff, and an AI revolution is its own signal — this is a business that earns high returns and doesn't need to borrow to grow.
NVIDIA's chart looks like a V. Quality turned negative in early 2023 — the gaming business was struggling and the AI transformation hadn't yet appeared in the earnings. Then the inflection hit, and the quality score went near-vertical, reaching the 100th percentile by mid-2026. It's one of the most dramatic fundamental recoveries in the S&P 500 over this period.
Tesla is the outlier in the wrong direction. Quality scores peaked near the 88th percentile in early 2023 when EV margins were strong. Price cuts, rising competition, and margin compression have since pushed the composite below the S&P 500 average. It's the only Mag 7 name currently below average — and nothing in the data suggests that's about to change.
Who's Actually Benefiting: The Infrastructure Suppliers
The companies building data centers need chips, equipment, memory, and networking. The firms supplying those inputs are benefiting from the capex cycle — but the quality picture looks very different depending on which part of the supply chain you're in.
Lam Research, Applied Materials, and KLA Corporation have sat above the 90th S&P 500 quality percentile for the entire five-year period — currently between the 95th and 99th. When hyperscalers spend more on AI chips, these companies sell more equipment to the fabs producing them. They get the demand tailwind without taking on the debt. Arista Networks tells a similar story on the networking side. Broadcom is slightly more complex — its quality score dipped when it absorbed the VMware acquisition — but has been recovering as that revenue comes through.
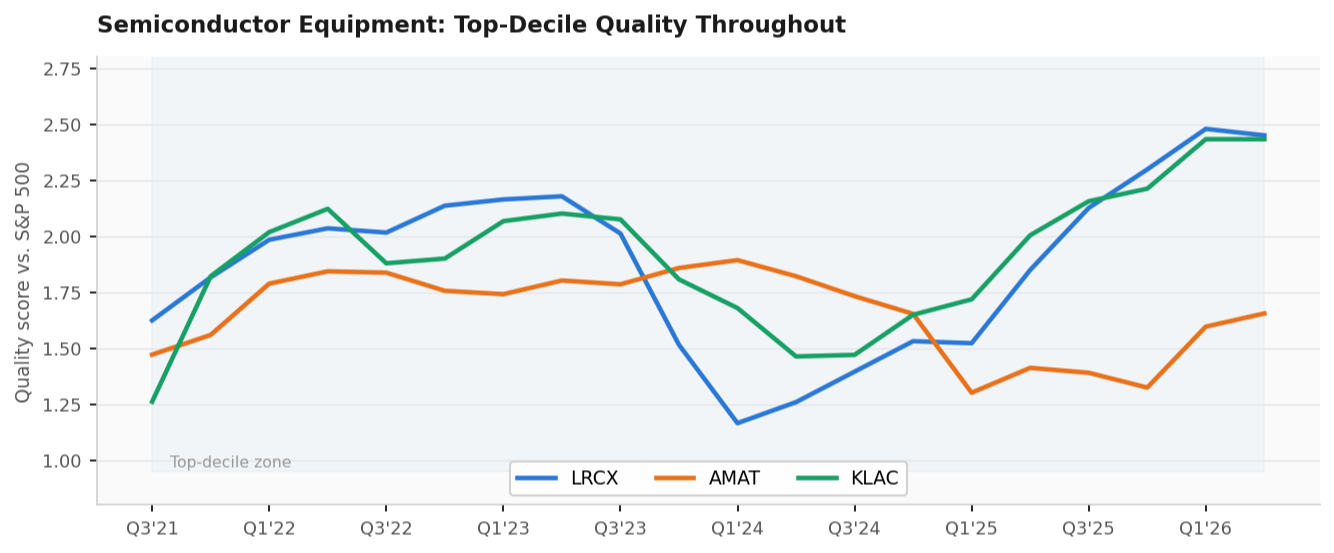
KLAC Q2 2026 forward-filled from Q1 2026. Scores computed cross-sectionally against the full S&P 500 universe. Source: Morningstar, as of June 30, 2026.
The memory and storage names tell a sharply different story.
Micron and Western Digital are cyclical businesses, and the charts make that unmistakable. Both dropped to the bottom 10th percentile of the S&P 500 during the 2022–2024 memory down-cycle — Western Digital reached the 5th percentile at the worst point. What brought them back was AI demand: data centers require large amounts of specialized memory and high-capacity storage, and both companies are key suppliers. As of mid-2026, both rank near the top of the S&P 500 quality composite.
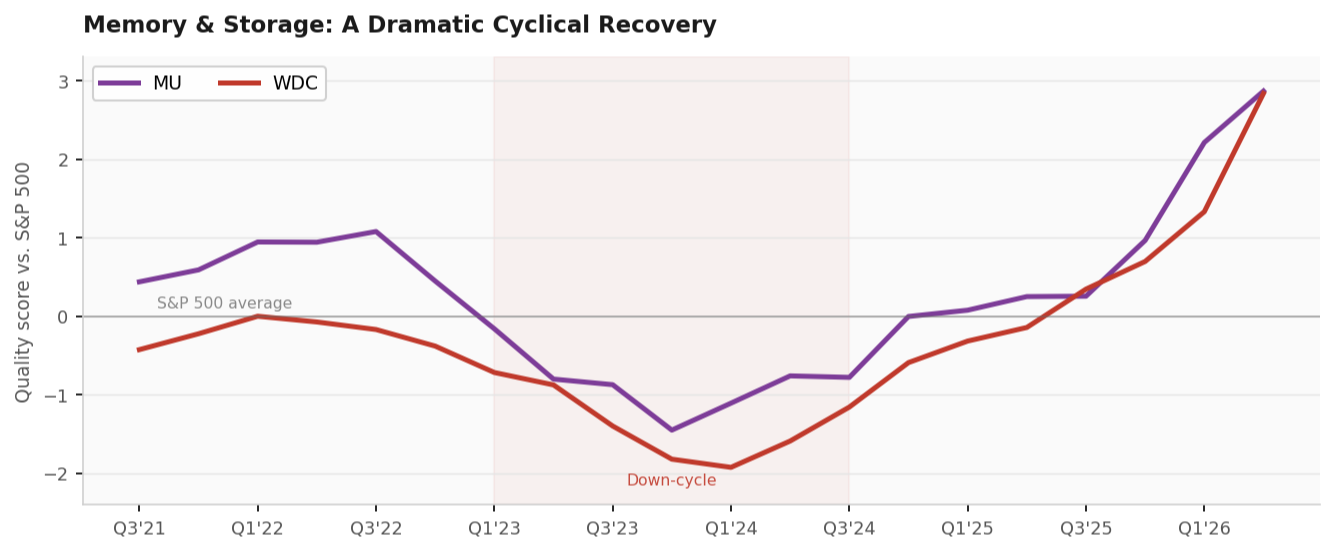
Shaded area marks the 2022–2024 down-cycle trough period. Source: Morningstar, as of June 30, 2026.
The important caveat: those strong scores are entirely dependent on what the hyperscalers do next. If the capex cycle holds, Micron and Western Digital benefit. If it slows, their quality scores will follow. These are high-quality businesses right now — but that quality is borrowed from the same AI infrastructure buildout driving the entire analysis.
What We're Watching
Alphabet's leverage. At its current pace, two or three more quarters of similar spending would start to show up in the quality score — even with profitability as strong as it is. It's the most important single data point to watch in the near term.
Meta's profitability vs. its rising leverage. Both are moving toward each other. Which force wins over the next year will determine where Meta lands in the quality ranking.
Amazon's Q2 leverage uptick (27% to 32%) after years of improvement. A quarter or two more of data will clarify whether that's a trend shift or noise.
Tesla has no quality catalyst visible in the data right now.
Micron and Western Digital are the highest-risk watch items. Their recovery was fast and real — and equally reversible. If hyperscaler spending holds, those scores hold. If it slows, the chart reverses.
Summary and Investor Implications
The broader message from five years of quality data: the Magnificent 7 is not a single story. Each name is on its own trajectory, and the companies supplying the infrastructure tell different stories still. Investors who treat this group as a monolith — allocating to all seven because they are all large and well-known — are accepting a range of quality profiles and balance sheet risks that vary more than the common label suggests.
Quality is one lens, not a verdict. Alphabet's rising leverage is a shifting risk profile worth monitoring — it is not, by itself, a sell signal. A strong quality score for Micron or Western Digital today reflects current business conditions, not a permanent characteristic. These same companies were near the bottom of the S&P 500 quality distribution 18 months ago. The score is real. So is the cycle.
Diversify across quality profiles, not just names. Microsoft and Apple offer stable, high-quality anchors. NVIDIA's quality score arrived fast and recently — the transformation was genuine, but the durability is still being established. Micron and Western Digital are strong right now but have proven deeply cyclical. Holding all of these in a portfolio means holding different risk stories under one umbrella. That can be appropriate — as long as it's intentional.
No single metric is the whole picture. Leverage rising at Alphabet says something about balance sheet risk. It says nothing about whether Search dominance is eroding, whether AI returns will materialize, or what the stock is worth. Quality analysis is an input into a broader view — not a conclusion on its own. The same is true for any individual signal: leverage, return on assets, earnings stability. Each illuminates one dimension of a business. None of them, alone, tells you what to do.
The equipment manufacturers deserve more attention than they typically get. Lam Research, Applied Materials, and KLA Corporation have delivered top-decile quality for five years without the balance sheet volatility of the hyperscalers they supply. For investors seeking AI infrastructure exposure with a more stable quality profile, the equipment side of the supply chain is worth examining alongside the headline names.
Hold cyclical quality scores with appropriate humility. Micron and Western Digital went from the bottom 10th quality percentile to near the top in roughly 18 months. That speed of reversal — in both directions — is the nature of cyclical businesses. A strong quality score in a cyclical name is a current reading, not a durable characteristic. It warrants a different level of conviction than the same score in a structurally stable business.
The goal of systematic quality analysis is not to reduce the investment decision to a single number — it's to bring discipline and consistency to how we evaluate businesses over time, across cycles, and relative to the broader market. The companies in this analysis range from some of the highest-quality businesses ever to exist, to names currently navigating real fundamental challenges, to cyclical recoveries that are real but contingent. Understanding which is which matters more than knowing the group average.
The material presented includes information and opinions provided by a party not related to Thrivent Advisor Network. It has been obtained from sources deemed reliable; but no independent verification has been made, nor is its accuracy or completeness guaranteed. The opinions expressed may not necessarily represent those of Thrivent Advisor Network or its affiliates. They are provided solely for information purposes and are not to be construed as solicitations or offers to buy or sell any products, securities, or services. They also do not include all fees or expenses that may be incurred by investing in specific products. Past performance is no guarantee of future results. Investments will fluctuate and when redeemed may be worth more or less than when originally invested. You cannot invest directly in an index. The opinions expressed are subject to change as subsequent conditions vary. Thrivent Advisor Network and its affiliates accept no liability for loss or damage of any kind arising from the use of this information.
______________________________________________
Any specific securities identified and described do not represent all the securities purchased, sold, or recommended for advisory clients. The reader should not assume that investments in the securities identified and discussed were or will be profitable. A summary description of the principal risks of investing in a particular model is available upon request. There can be no assurance that a model will achieve its investment objectives. Investment strategies employed by the advisor in selecting investments for the model portfolio may not result in an increase in the value of your investment or in overall performance equal to other investments. The model portfolio’s investment objectives may be changed at any time without prior notice. Portfolio allocations are based on a model portfolio, which may not be suitable for all investors. Clients should also consider the transactions costs and/or tax consequences that might result from rebalancing a model portfolio. Frequent rebalancing may incur additional costs and/or tax consequences versus less rebalancing. Please notify us if there have been any changes to your financial situation or your investment objectives, or if you would like to place or modify any reasonable restrictions on the management of your account.
This communication may include forward looking statements. Specific forward-looking statements can be identified by the fact that they do not relate strictly to historical or current facts and include, without limitation, words such as “may,” “will,” “expects,” “believes,” “anticipates,” “plans,” “estimates,” “projects,” “targets,” “forecasts,” “seeks,” “could’” or the negative of such terms or other variations on such terms or comparable terminology. These statements are not guarantees of future performance and involve risks, uncertainties, assumptions and other factors that are difficult to predict and that could cause actual results to differ materially.
The Magnificent 7 stocks are a group of mega-cap stocks that drive the market’s performance due to their heavy weighting in major stock indexes such as the Standard & Poor’s 500 and the Nasdaq 100. The group’s seven stocks earned their name in 2023 due to their strong performance and ability to power indexes higher seemingly without help from smaller stocks. The Magnificent 7 includes the following: Apple (AAPL), Microsoft (MSFT), Alphabet (GOOG and GOOGL), Amazon (AMZN), NVIDIA (NVDA), Tesla (TSLA), and Meta Platforms (META).
Capital expenditure or capital expense (abbreviated capex, CAPEX, or CapEx) is the money an organization or corporate entity spends to buy, maintain, or improve its fixed assets, such as buildings, vehicles, equipment, or land
The Standard & Poor's 500 (S&P 500) is a market-cap weighted index comprised of the common stocks of 500 leading companies in leading industries of the U.S. economy. You cannot invest directly in an index.
Advisory Persons of Thrivent Advisor Network provide advisory services under a “doing business as” name or may have their own legal business entities. However, advisory services are engaged exclusively through Thrivent Advisor Network, LLC, a registered investment adviser. RetirePath Advisors and Thrivent Advisor Network, LLC are not affiliated companies. Information in this message is for the intended recipient[s] only. Please visit our website retirepathadvisors.com for important disclosures.