


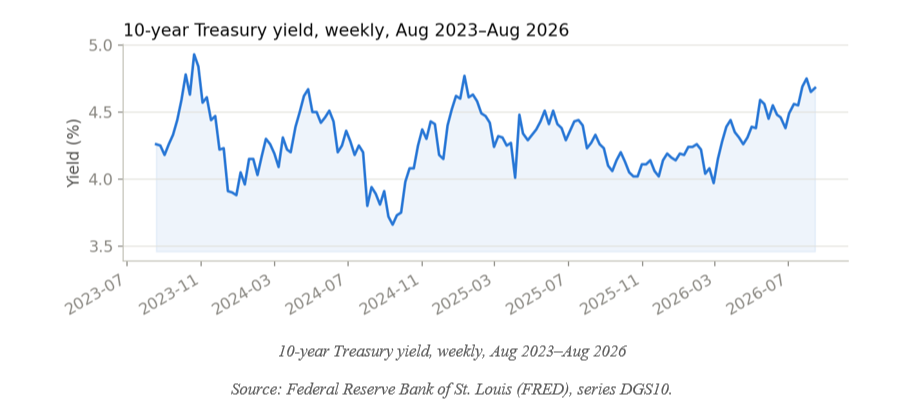
If you've watched the 10-year Treasury yield over the past three years, "volatile" undersells it. Since August 2023, the 10-year has ranged from 3.63% to 4.98% — a swing of more than 130 basis points from peak to trough, including a 116-basis-point round trip back up in under four months. The daily standard deviation alone tells you this wasn't a slow drift; it was a series of sharp reversals.
Given that kind of chop, you'd expect a rough few years for bond holders. Instead, the Bloomberg US Aggregate Bond Index ETF (AGG) delivered a 14.25% cumulative return, 4.54% annualized, over that same stretch. There was some pain along the way — a maximum drawdown of -4.86%, driven by the yield spike from 3.63% in September 2024 to 4.79% by January 2025 — but the index climbed back above its prior high by about five and a half months after that January 2025 low, and kept compounding from there.
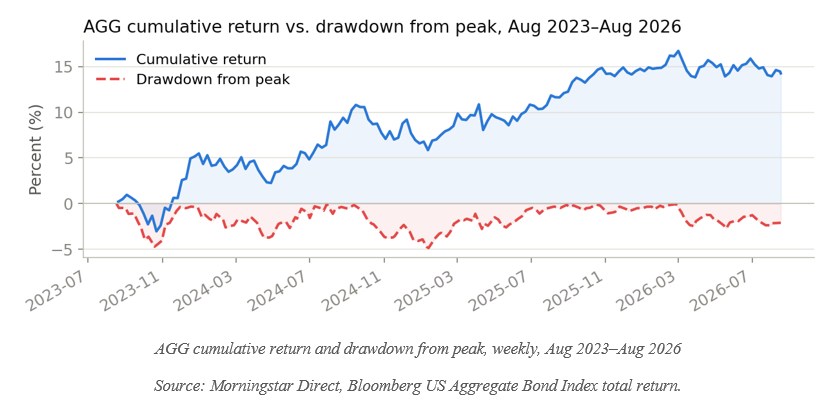
A quick caveat: Bloomberg US Aggregate Bond Index ETF isn't a pure Treasury fund — it also holds corporates, MBS, and agencies — so this is really a story about how Treasury yield levels have tracked broad investment-grade bond returns, not a 1:1 mechanical link. The relationship has held up well, but it's a proxy, not an identity.
Why didn't the volatility do more damage?
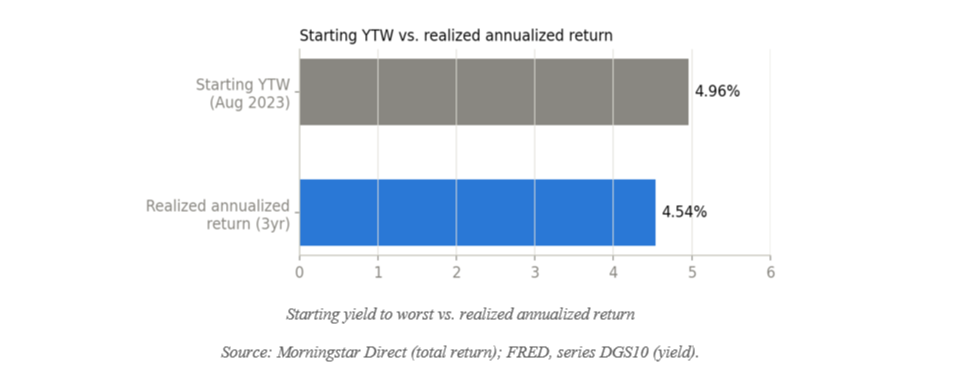
Most of a bond's multi-year return doesn't come from where prices happen to be on any given day — it comes from income. AGG's yield-to-worst back in August 2023 was 4.96%. Three years later, the realized annualized return landed at 4.54% — a gap of just 42 basis points (in the investor’s favor). Despite everything the 10-year did in between, the starting yield turned out to be close to the realized outcome over this time period.
Is that a fluke, or does it hold up historically?
I tested it: 204 rolling three-year windows since 2006, stepped monthly, comparing the starting 10-year yield to the AGG’s subsequent three-year annualized return. Across the full sample, the median absolute gap between the two was 1.6 percentage points — a reasonably tight fit, but not perfect.
One period explains most of the miss. The 36 windows starting between January 2019 and December 2021 — when yields sat near zero and core inflation was about to surge to a four-decade high, forcing the Fed into its fastest hiking cycle in a generation — missed by a median of over 4 points, virtually all in the same direction. Strip those out, and the median gap across the remaining 168 windows tightens to 1.3 points, with nearly half landing within a single point of the starting yield.
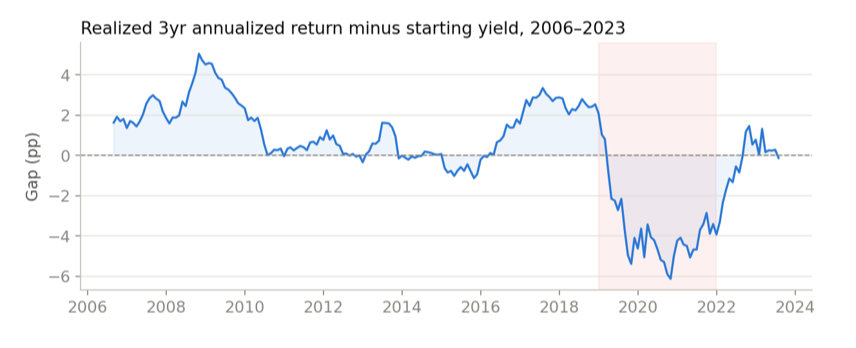
Gap between realized return and starting yield, 2006–2023
Source: Morningstar Direct (total return); FRED, series DGS10 (yield). Calculations are the author’s.
Inflation regime may matter more than you’d think
I also split the same 204 windows by whether Core CPI was rising, falling, or roughly flat in the six months before each starting date. The pattern is clean: flat-inflation regimes produced the tightest fit — a median absolute gap of 1.3 points, with a small positive bias (returns modestly beat starting yield). Both rising and falling regimes roughly doubled that error, and rising regimes carried an added problem: a -1.29 point average bias, meaning returns tended to fall short of the starting yield when inflation was actively accelerating — unsurprising, since that’s exactly when the Fed is most likely to hike and potentially push bond prices down.
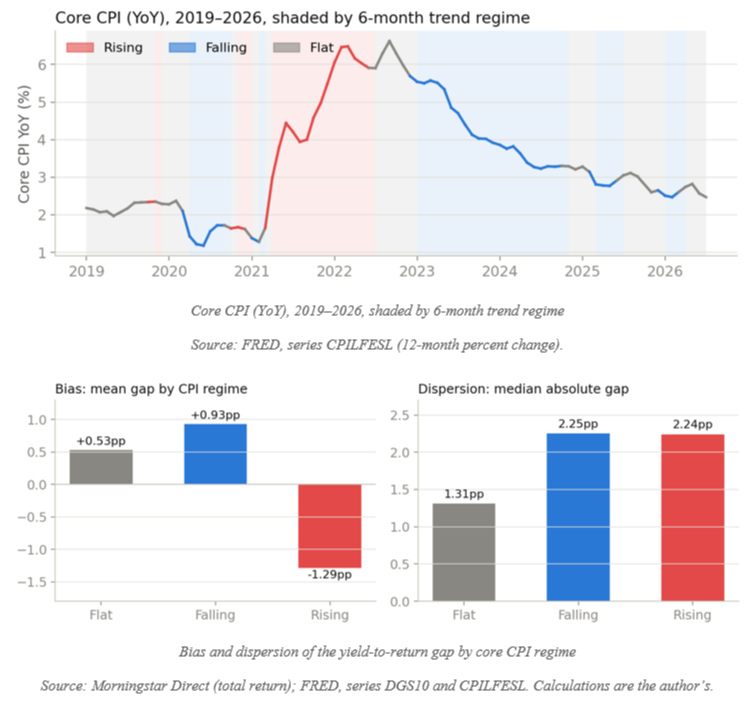
The rising-regime bias isn’t uniform — starting yield matters there too
That -1.29 point average bias in rising-inflation windows is real, but it isn’t evenly spread. Splitting the 37 rising-CPI windows at their median starting yield (2.0%) shows the bias is concentrated almost entirely in the lower half: windows that started at 2.0% or below missed by a mean of -3.18 points, while windows that started above 2.0% actually missed by a mean of +0.70 points — essentially flat to modestly positive, despite inflation still accelerating. The lower-yield group is almost entirely the 2019–2021 cohort discussed above: starting yields left little or no income cushion when the shock hit.
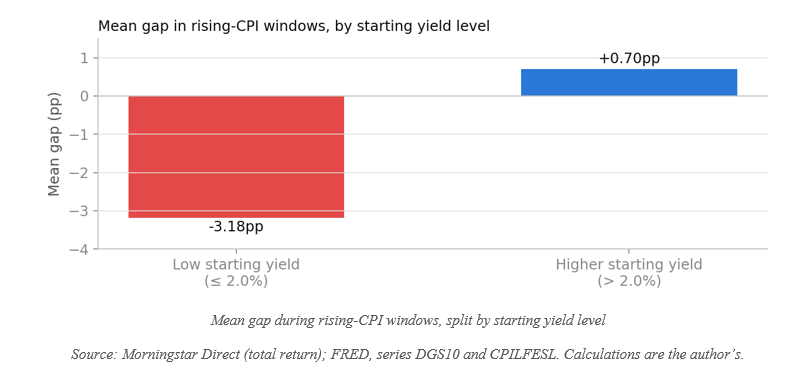
The current 10-year yield, around 4.7% as of Aug 2026, sits well above even the higher-yield half of that historical split (which topped out near 4.0%). Historically, in this data, a larger starting-yield cushion has coincided with a smaller downside bias when inflation was rising — that is a pattern observed in the past, not a guarantee about how any future inflation surprise would play out, but it is a relevant data point if Core CPI were to turn higher again from here.
Where that leaves us
Core CPI has been in a falling regime for most of the past two years, but the most recent readings — May through July 2026 — show the six-month trend essentially flattening out near 2.5%. In prior periods sharing this pattern, the yield-to-return relationship has tended to be tighter, not looser — though that is a historical tendency, not a projection. It’s also a possible young signal: a few months, not the year-plus stretches that defined past “flat” regimes in this data.
A few months of flat CPI prints doesn’t confirm a durable regime any more than a few months of falling prints did back in late 2024, right before inflation reaccelerated. Historical patterns like these may describe what has happened in the past under similar conditions; they are not a prediction of what core CPI, interest rates, or bond returns will do next, and they should not be relied upon as one.
Bottom line
Pulling the study together: the 10-year treasury bond yield has been genuinely volatile over the past three years, yet the Aggregate Bond Index ETF still delivered a solid 4.54% annualized return — landing within 42 basis points of its starting yield. Widening the lens to 20 years and 204 rolling three-year windows, that relationship holds up as a reasonable, though imperfect, anchor — tightest when inflation is flat, noisier when inflation is trending either direction, and worst of all in the specific case of a low starting yield colliding with a rising-inflation shock, as it did in 2019–2021.
Where that leaves us today: Core CPI has recently flattened after two years of decline, and the starting yield on offer (~4.7%) is well above the level that provided little cushion during the last inflation surprise. Both of those facts may point in a constructive direction for the yield-to-return relationship going forward
That’s the case for staying diligent and diversified: diligent in continuing to track how inflation, yields, and duration positioning interact rather than assuming today’s setup persists, and diversified across maturities, sectors, and asset classes so that no single regime shift — inflation, rates, or otherwise — can do outsized damage to a portfolio built on any one historical pattern.
Total return data sourced from Morningstar Direct; 10-year Treasury yield and core CPI data sourced from the Federal Reserve Bank of St. Louis (FRED), series DGS10 and CPILFESL. All calculations and groupings (rolling windows, regime classifications, gap statistics) are the author’s own and are provided for illustrative purposes.
Disclosures & Definitions
Advisory Persons of Thrivent Advisor Network provide advisory services under a “doing business as” name or may have their own legal business entities. However, advisory services are engaged exclusively through Thrivent Advisor Network, LLC, a registered investment adviser. RetirePath Advisors and Thrivent Advisor Network, LLC are not affiliated companies. Information in this message is for the intended recipient[s] only. Please visit our website www.retirepathadvisors.com for important disclosures.
Return figures are not reflective of any specific product, and do not include all fees or expenses that may be incurred by investing in specific products. The return figures quoted are subject to any error of any of the types of data sources that may be contributing to it, including manual entry errors and data reliability or completeness errors. The information herein is from sources deemed to be reliable, but its accuracy cannot be guaranteed.
IMPORTANT: Advisory Person(s) may use proprietary financial planning tools, calculators and third-party tools and materials ("Third-Party Materials") to develop your financial planning recommendations. The projections or other information generated by Third-Party Materials regarding the likelihood of various investment outcomes are hypothetical in nature, do not reflect actual investment results, and are not guarantees of future results. Results may vary with each use and over time. Thrivent Advisor Network, LLC and its advisors do not provide legal, accounting or tax advice. Consult your attorney and or tax professional regarding these situations.
The return assumptions in Third-Party Materials are not reflective of any specific product, and do not include any fees or expenses that may be incurred by investing in specific products. The actual returns of a specific product may be more or less than the returns used. It is not possible to directly invest in an index. Financial forecasts, rates of return, risk, inflation, and other assumptions may be used as the basis for illustrations. They should not be considered a guarantee of future performance or a guarantee of achieving overall financial objectives. Past performance is not a guarantee or a predictor of future results of either the indices or any particular investment. Investing involves risks, including the possible loss of principal.
This material is provided for informational purposes only and is not solely intended to be relied upon as a forecast, research or investment advice, and is not a recommendation, offer or solicitation to buy or sell any securities or to adopt any investment strategy. The views and strategies described may not be suitable for all investors. They also do not include all fees or expenses that may be incurred by investing in specific products. Past performance is no guarantee of future results. Investments will fluctuate and when redeemed may be worth more or less than when originally invested. You cannot invest directly in an index. The opinions expressed are subject to change as subsequent conditions vary. Advisory services offered through Thrivent Advisor Network, LLC.
This communication may include forward looking statements. Specific forward-looking statements can be identified by the fact that they do not relate strictly to historical or current facts and include, without limitation, words such as “may,” “will,” “expects,” “believes,” “anticipates,” “plans,” “estimates,” “projects,” “targets,” “forecasts,” “seeks,” “could’” or the negative of such terms or other variations on such terms or comparable terminology. These statements are not guarantees of future performance and involve risks, uncertainties, assumptions and other factors that are difficult to predict and that could cause actual results to differ materially.
Index Benchmarks presented within this report may not reflect factors relevant for your portfolio or your unique risks, goals or investment objectives. Past performance of an index is not an indication or guarantee of future results. It is not possible to invest directly in an index.
The Bloomberg Aggregate Bond® Index, or "Agg" (for aggregate), is a broad-based fixed-income index used by bond traders, mutual funds, and ETFs as a benchmark to measure their relative performance.
The Consumer Price Index (CPI) is a measure of the average change over time in the prices paid by urban consumers for a market basket of consumer goods and services.
FRED (Federal Reserve Economic Data) is an online database consisting of hundreds of thousands of economic data time series from scores of national, international, public, and private sources.